Web Attack Forensics - Drone Alone (TryHackMe) 🎉🧑🎄
Modern web applications are a prime target for attackers because they sit at the boundary between users and internal systems. A single vulnerable endpoint can act as a gateway from harmless-looking HTTP traffic into full operating system compromise. Defending against these attacks requires visibility across multiple layers — from web server requests to the processes running on the host itself.
Splunk plays a critical role in web security by acting as a centralized platform where logs from different sources can be correlated in near real time. By ingesting Apache access and error logs alongside host-based telemetry such as Sysmon, defenders can move beyond isolated alerts and instead reconstruct attacker behaviour step by step. Obfuscated payloads, unusual request patterns, and unexpected child processes become much easier to spot when viewed through this combined lens.
In this investigation, Splunk enables a Blue Team approach to incident response: detecting suspicious web requests, validating whether exploitation occurred, uncovering attacker reconnaissance, and decoding hidden payloads. Rather than relying on a single indicator, the analysis demonstrates how layered logging and correlation turn fragmented evidence into a coherent attack narrative.
Introduction
The Story

TBFC’s drone scheduler web UI is getting strange, long HTTP requests containing Base64 chunks. Splunk raises an alert: “Apache spawned an unusual process.” On some endpoints, these requests cause the web server to execute shell code, which is obfuscated and hidden within the Base64 payloads. For this room, your job as the Blue Teamer is to triage the incident, identify compromised hosts, extract and decode the payloads and determine the scope.
You’ll use Splunk to pivot between web (Apache) logs and host-level (Sysmon) telemetry.
Follow the investigation steps below; each corresponds to a Splunk query and investigation goal.
Learning Objectives
Detect and analyze malicious web activity through Apache access and error logs
Investigate OS-level attacker actions using Sysmon data
Identify and decode suspicious or obfuscated attacker payloads
Reconstruct the full attack chain using Splunk for Blue Team investigation
Web Attack Forensics
Logging into Splunk
After you have started the AttackBox and the target machine in the previous task, allow the system around 3 minutes to fully boot, then use Firefox on the AttackBox to access the Splunk dashboard at http://MACHINE_IP:8000 using the credentials below.
Credentials
To access Splunk dashboard
Username
Blue
Password
Pass1234
IP address
MACHINE_IP
Connection via
HTTPhttp://MACHINE_IP:8000
The Splunk login page should look similar to the screenshot shown below.
After logging in successfully, you will be taken to the Search Page as shown in the screenshot below.
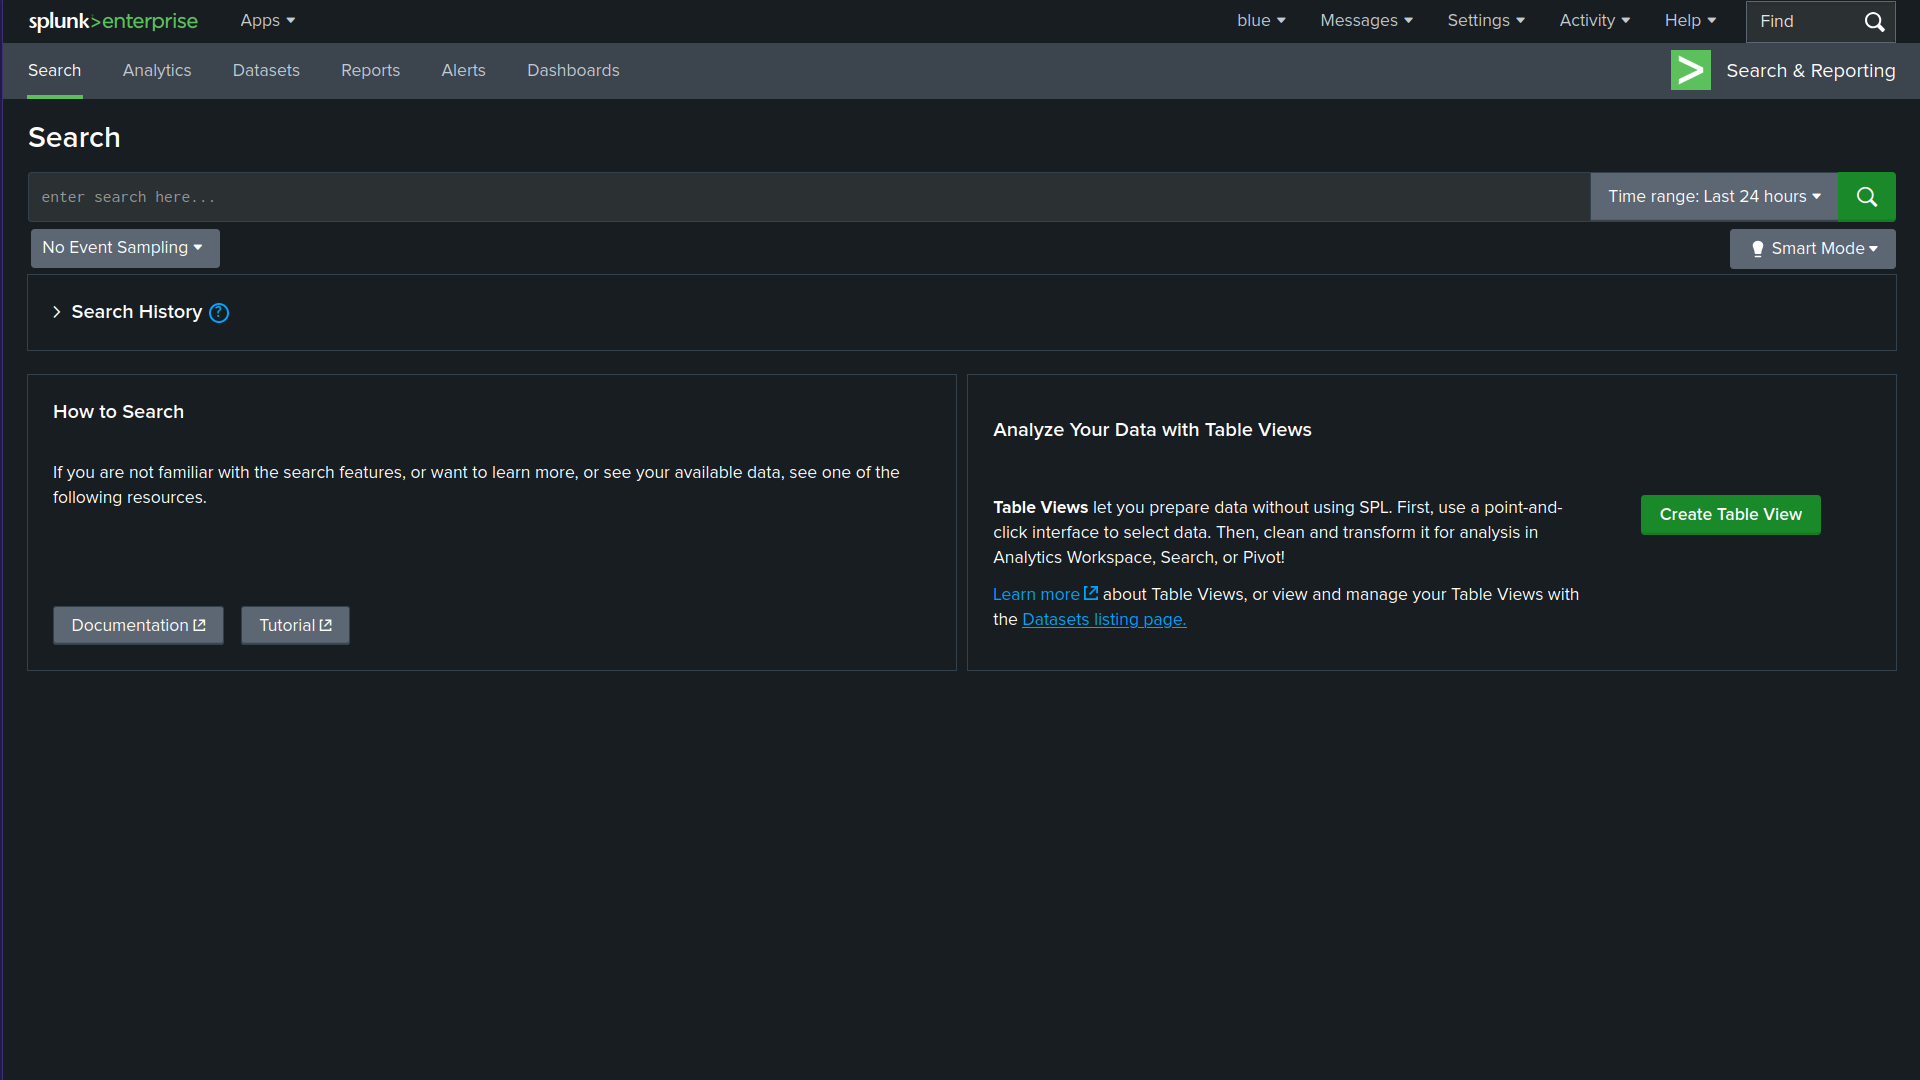
Make sure to adjust the Splunk time range to include the time of the events (e.g., "Last 7 days" or "All time"). If the default range is too narrow, you may see "No results found."
A Blue Teamer would explore various attack angles via Splunk. In this task, we will follow elf Log McBlue, who uses his Splunk magic to unravel the attack path.
Detect Suspicious Web Commands
In the first step, let’s search for HTTP requests that might show malicious activity. The query below searches the web access logs for any HTTP requests that include signs of command execution attempts, such as cmd.exe, PowerShell, or Invoke-Expression. This query helps identify possible Command Injection attacks, where the evil attacker tries to execute system commands through a vulnerable CGI script (hello.bat).
index=windows_apache_access (cmd.exe OR powershell OR "powershell.exe" OR "Invoke-Expression") | table _time host clientip uri_path uri_query status
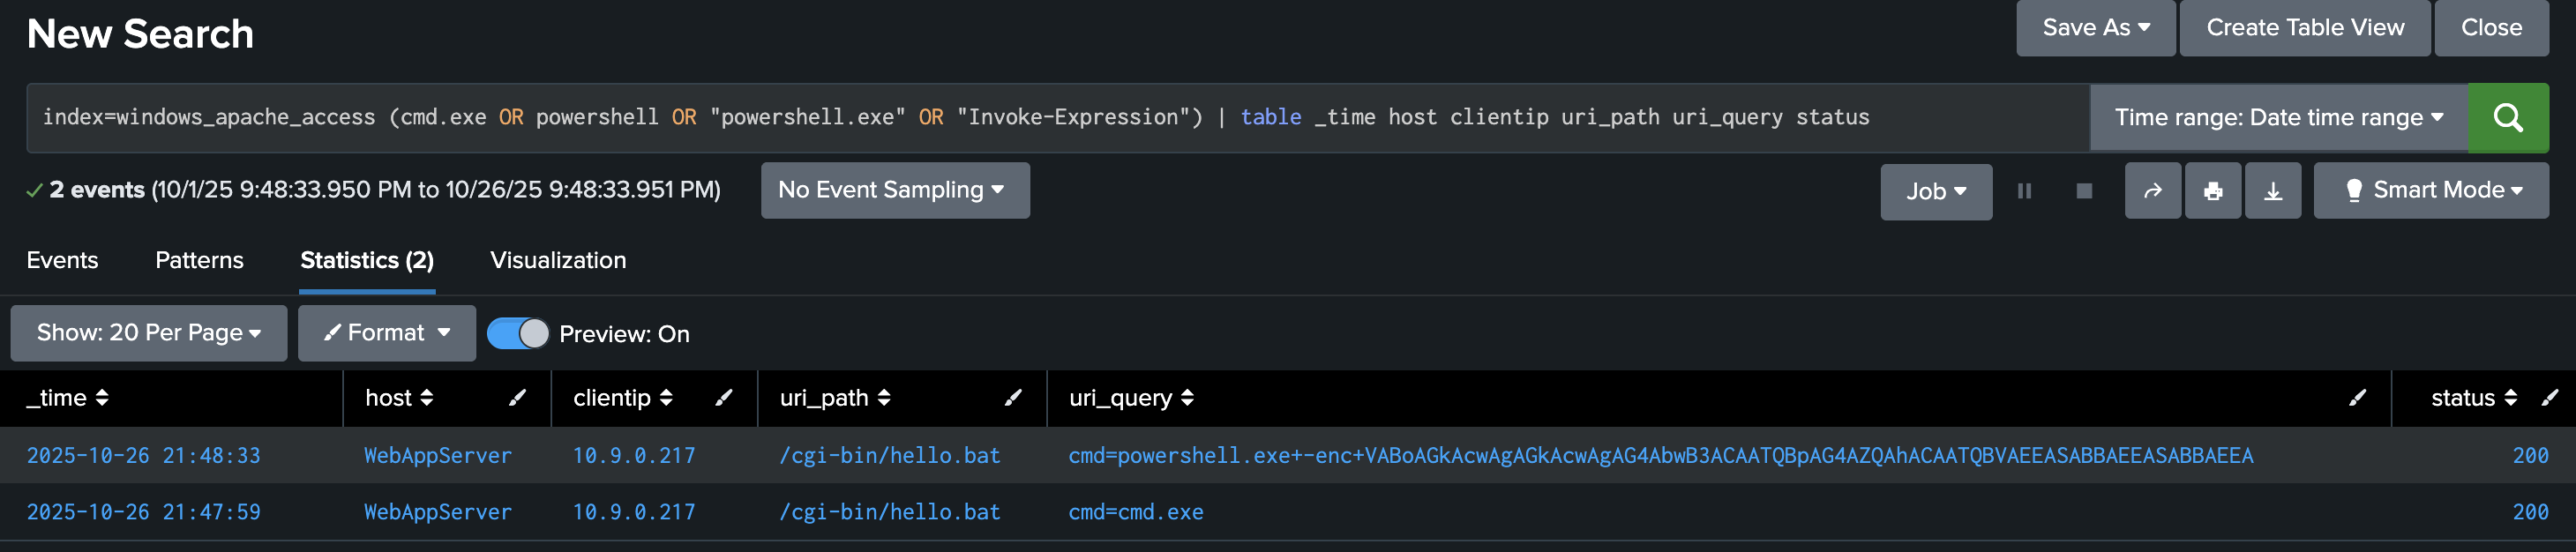
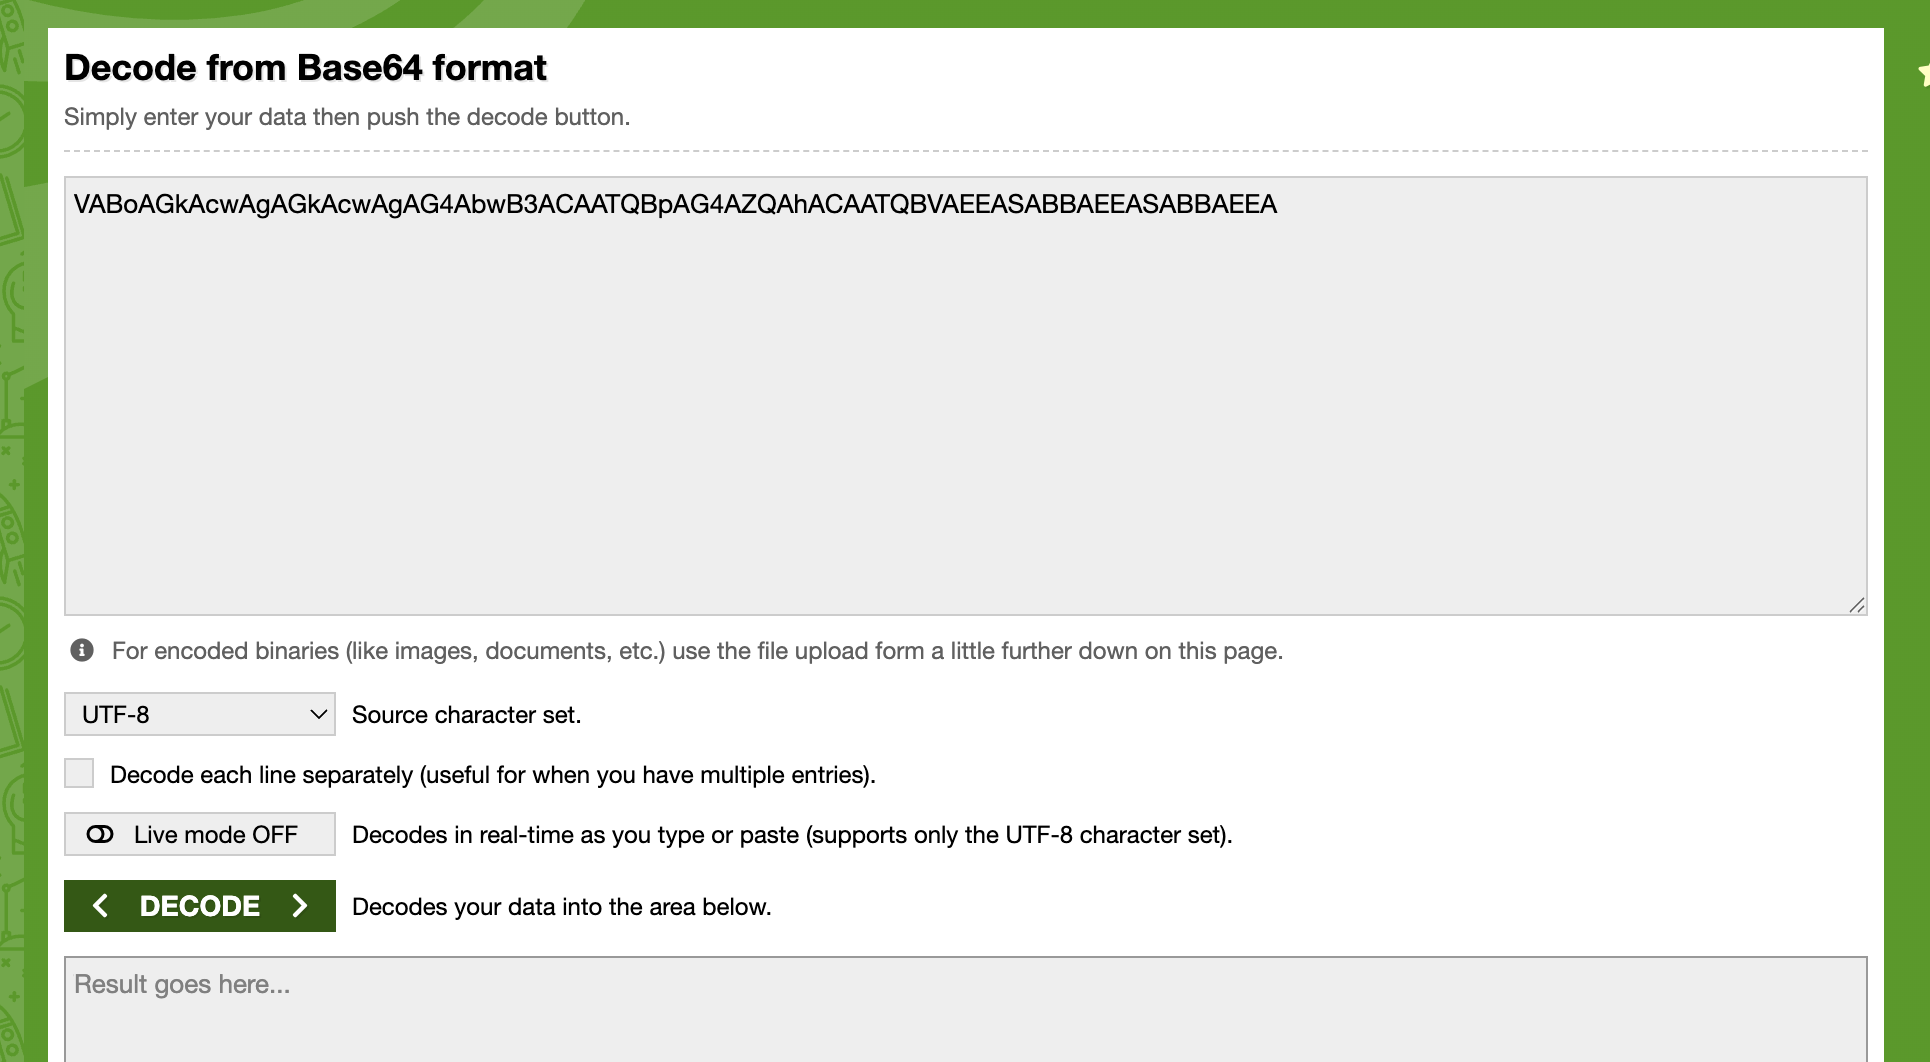
At this step, we are primarily interested in base64-encoded strings, which may reveal various types of activities. Once you spot encoded PowerShell commands, decode them using base64decode.org or your favourite base64 decoder to understand what the attacker was trying to do. Based on the results we received, let’s copy the encoded PowerShell string VABoAGkAcwAgAGkAcwAgAG4AbwB3ACAATQBpAG4AZQAhACAATQBVAEEASABBAEEASABBAEEA and paste it into https://www.base64decode.org/ upper field, then click on decode as shown in the screenshot below.
Looking for Server-Side Errors or Command Execution in Apache Error Logs
In this stage, we will focus on inspecting web server error logs, as this would help us uncover any malicious activity. We will use the following query:
index=windows_apache_error ("cmd.exe" OR "powershell" OR "Internal Server Error")
This query inspects the Apache error logs for signs of execution attempts or internal failures caused by malicious requests. As you can tell, we are searching for error messages with particular terms such as cmd.exe and powershell.
Please make sure you select View: Raw from the dropdown menu above the Event display field.
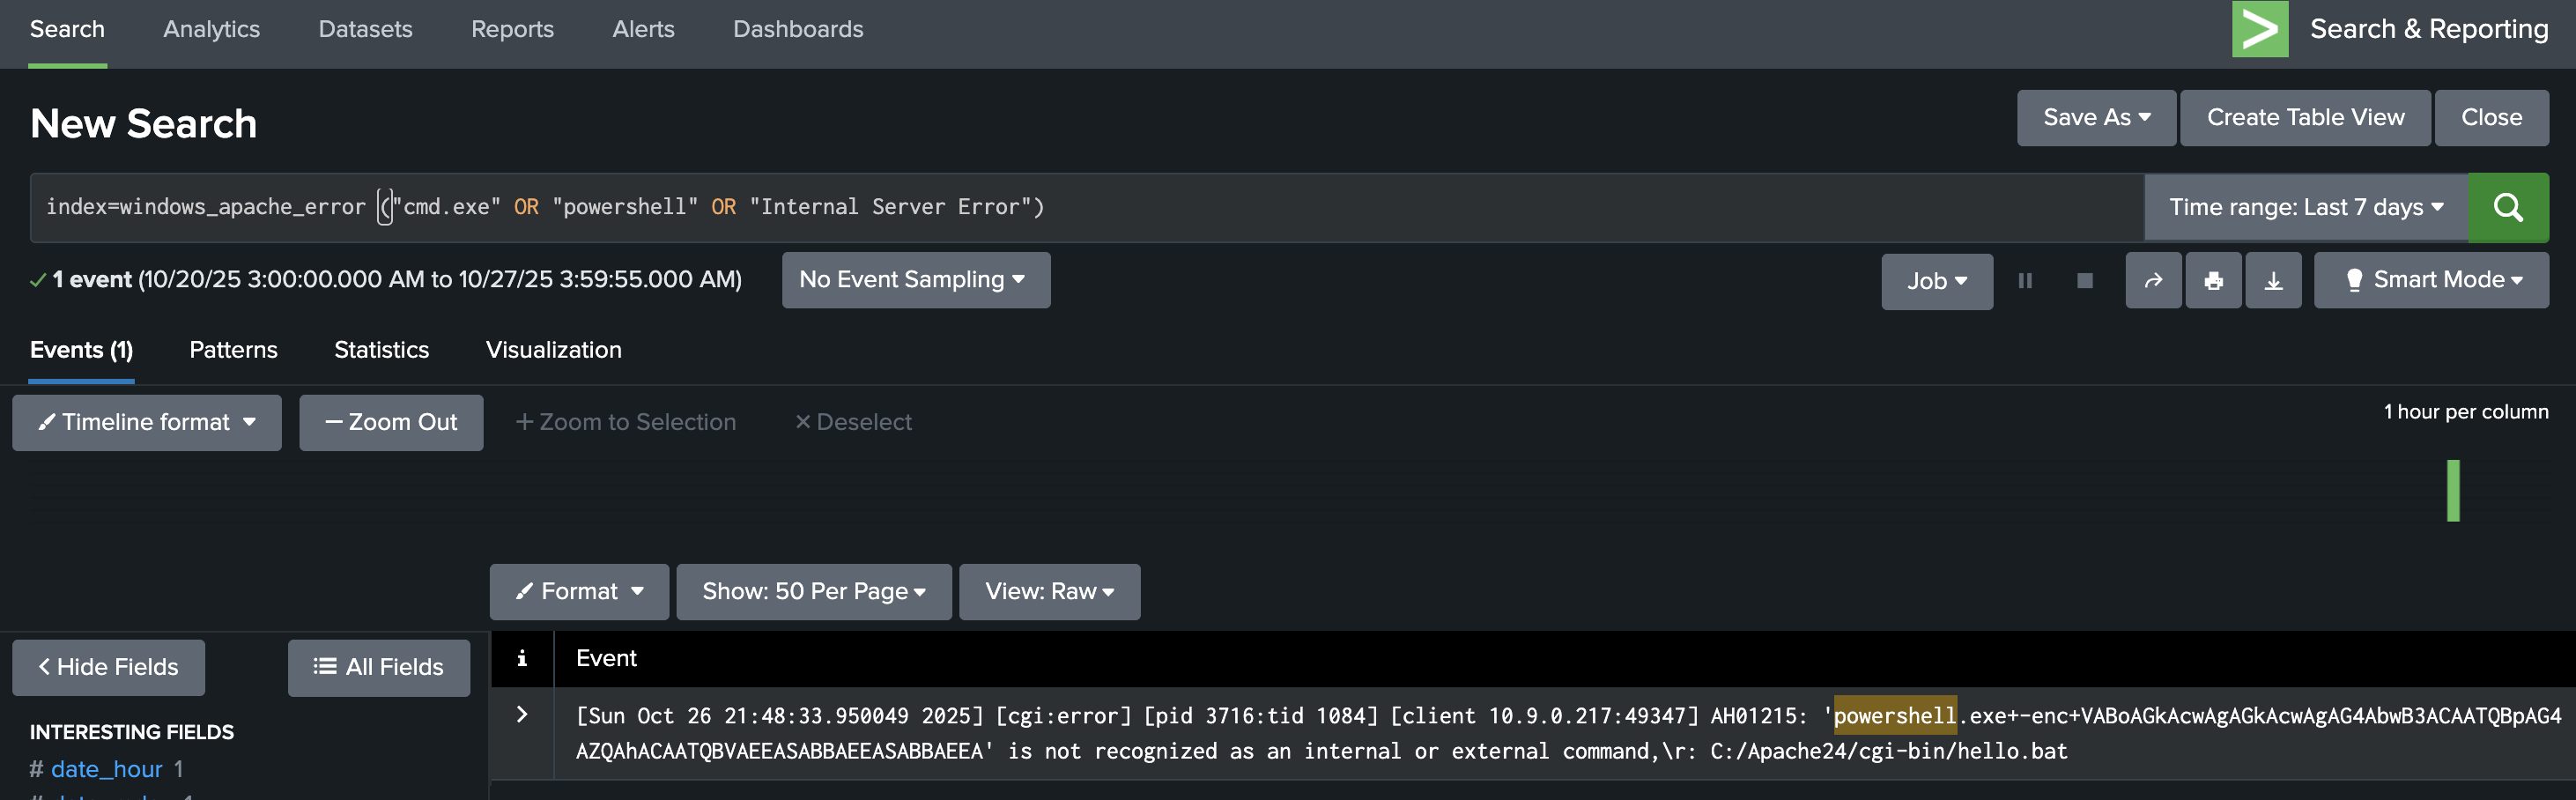
If a request like /cgi-bin/hello.bat?cmd=powershell triggers a 500 “Internal Server Error,” it often means the attacker’s input was processed by the server but failed during execution, a key sign of exploitation attempts.
Checking these results helps confirm whether the attack reached the backend or remained blocked at the web layer.
Trace Suspicious Process Creation From Apache
Let’s explore Sysmon for other malicious executable files that the web server might have spawned. We will do that using the following Splunk query:
index=windows_sysmon ParentImage="*httpd.exe"
This query focuses on process relationships from Sysmon logs, specifically when the parent process is Apache (httpd.exe).
Select View: Table on the dropdown menu above the Event display field.
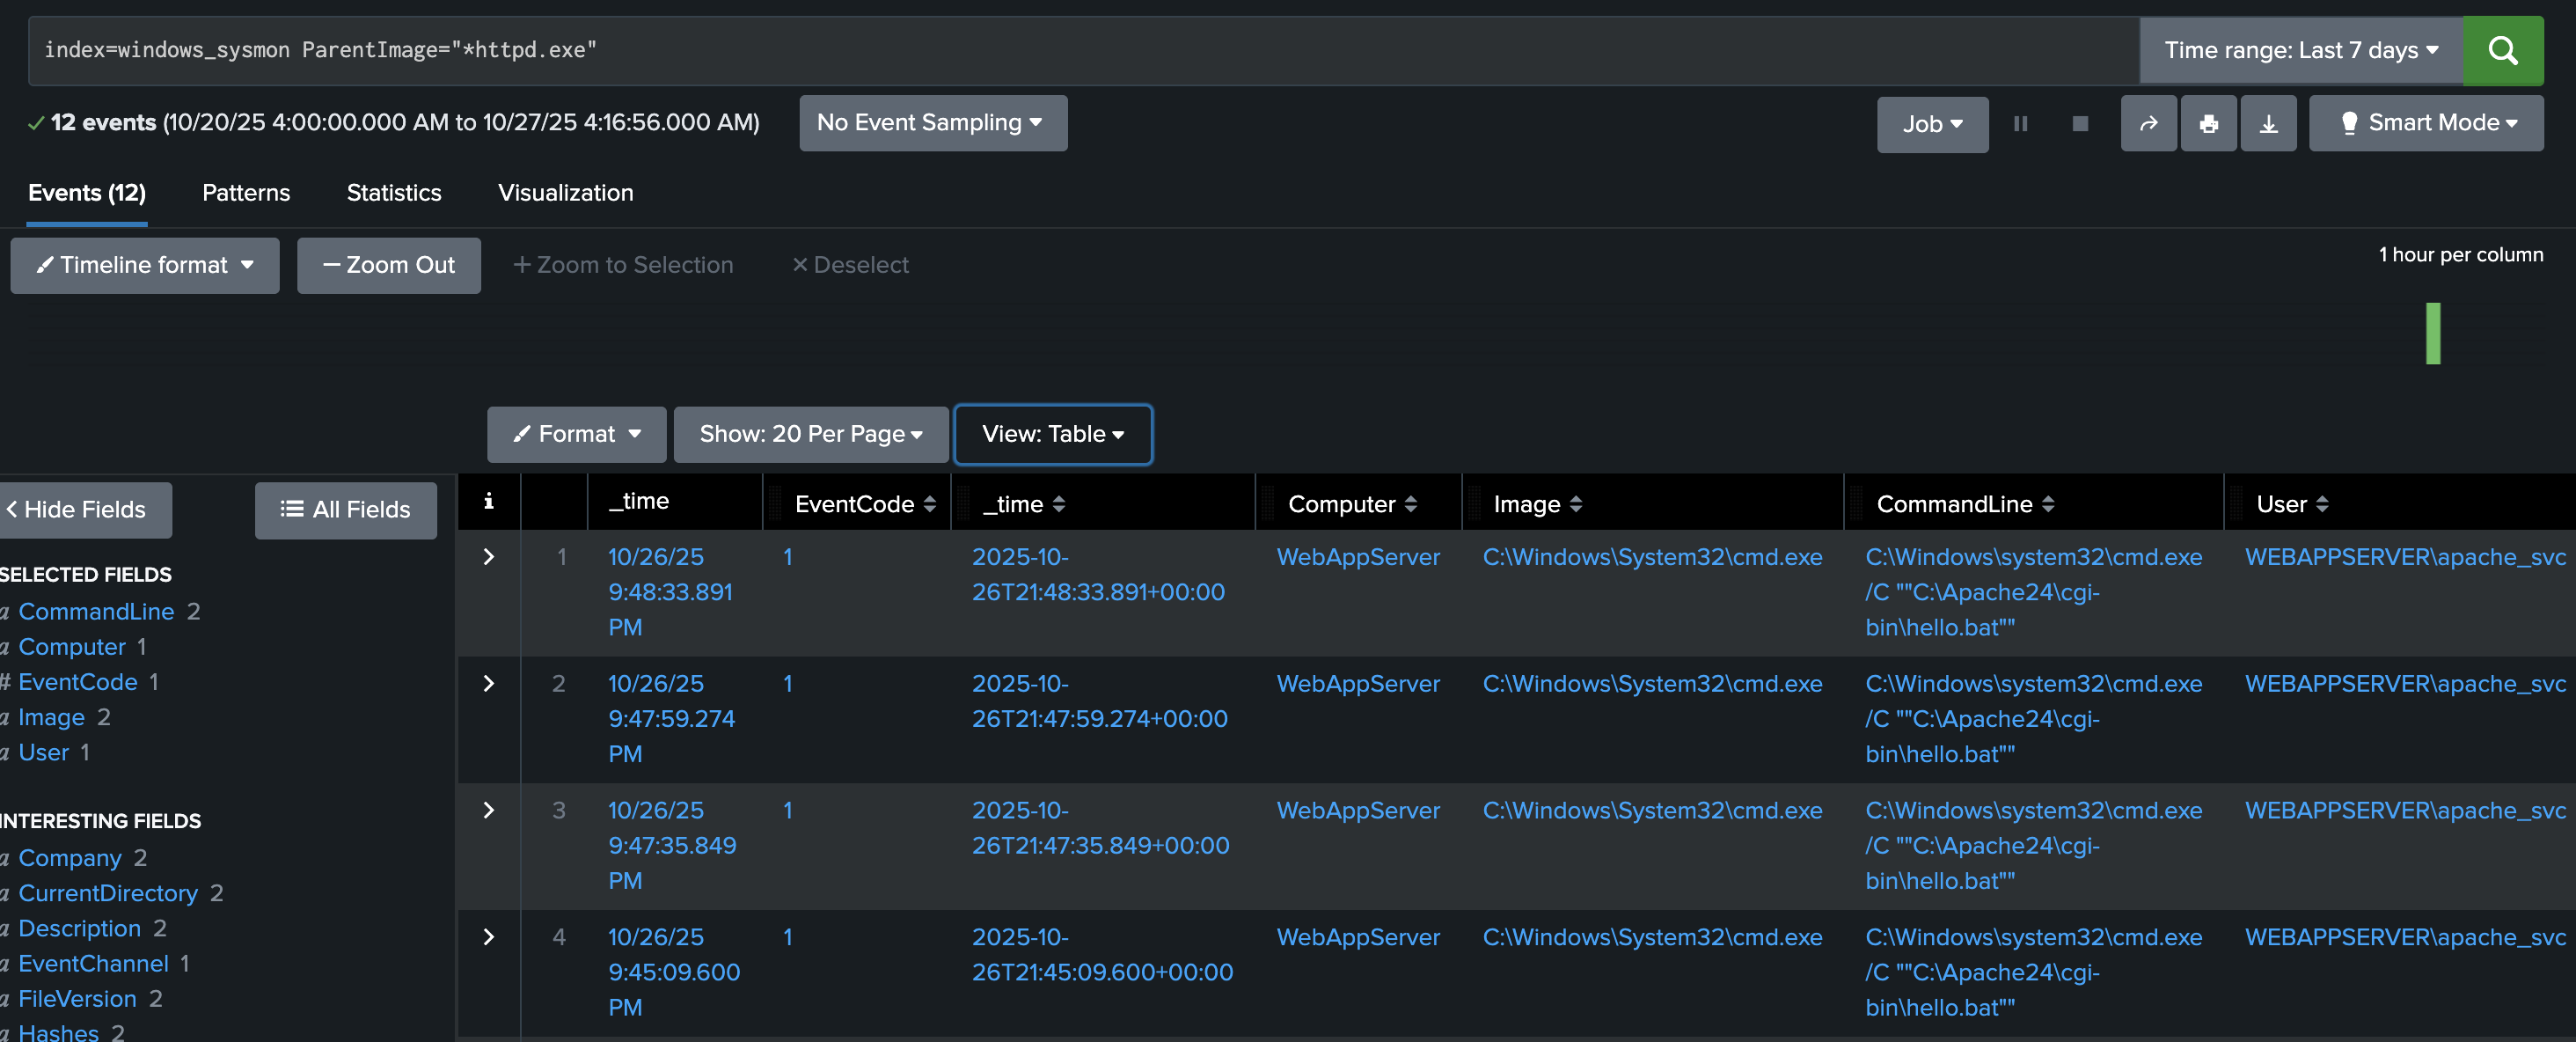
Typically, Apache should only spawn worker threads, not system processes like cmd.exe or powershell.exe.
If results show child processes such as:
ParentImage = C:\Apache24\bin\httpd.exe
Image = C:\Windows\System32\cmd.exe
It indicates a successful command injection where Apache executed a system command.
The finding above is one of the strongest indicators that the web attack penetrated the operating system.
Confirm Attacker Enumeration Activity
In this step, we aim to discover what specific programs we found from previous queries do. Let’s use the following query.
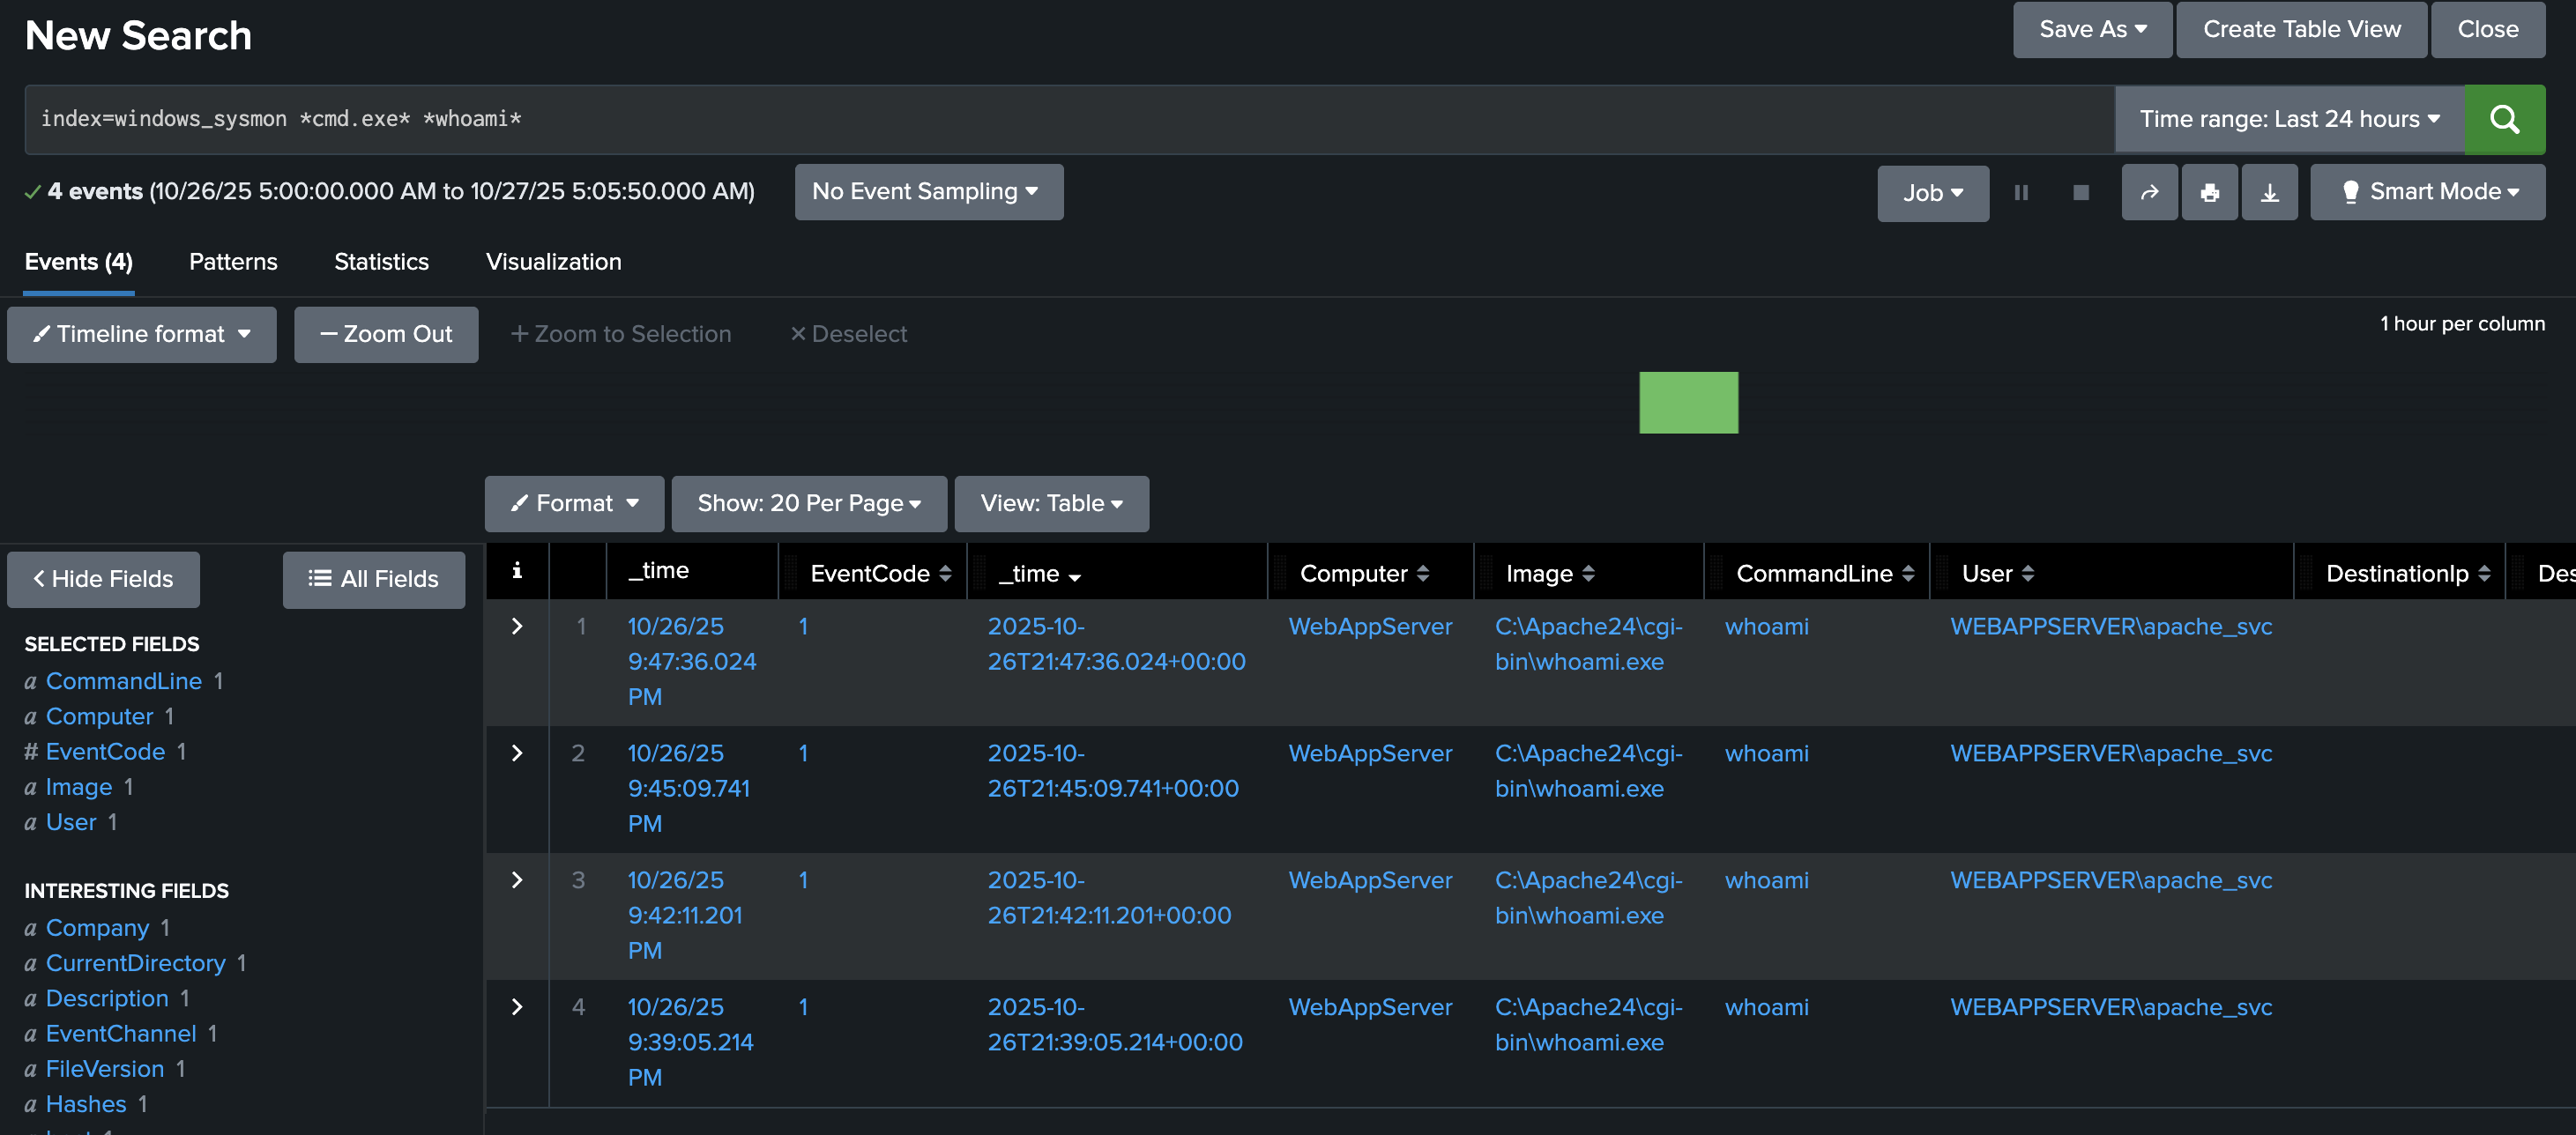
index=windows_sysmon *cmd.exe* *whoami*
This query looks for command execution logs where cmd.exe ran the command whoami.
Attackers often use the whoami command immediately after gaining code execution to determine which user account their malicious process is running as.
Finding these events confirms the attacker’s post-exploitation reconnaissance, showing that the injected command was executed on the host.
Identify Base64-Encoded PowerShell Payloads
In this final step, we will work to find all successfully encoded commands. To search for encoded strings, we can use the following Splunk query:
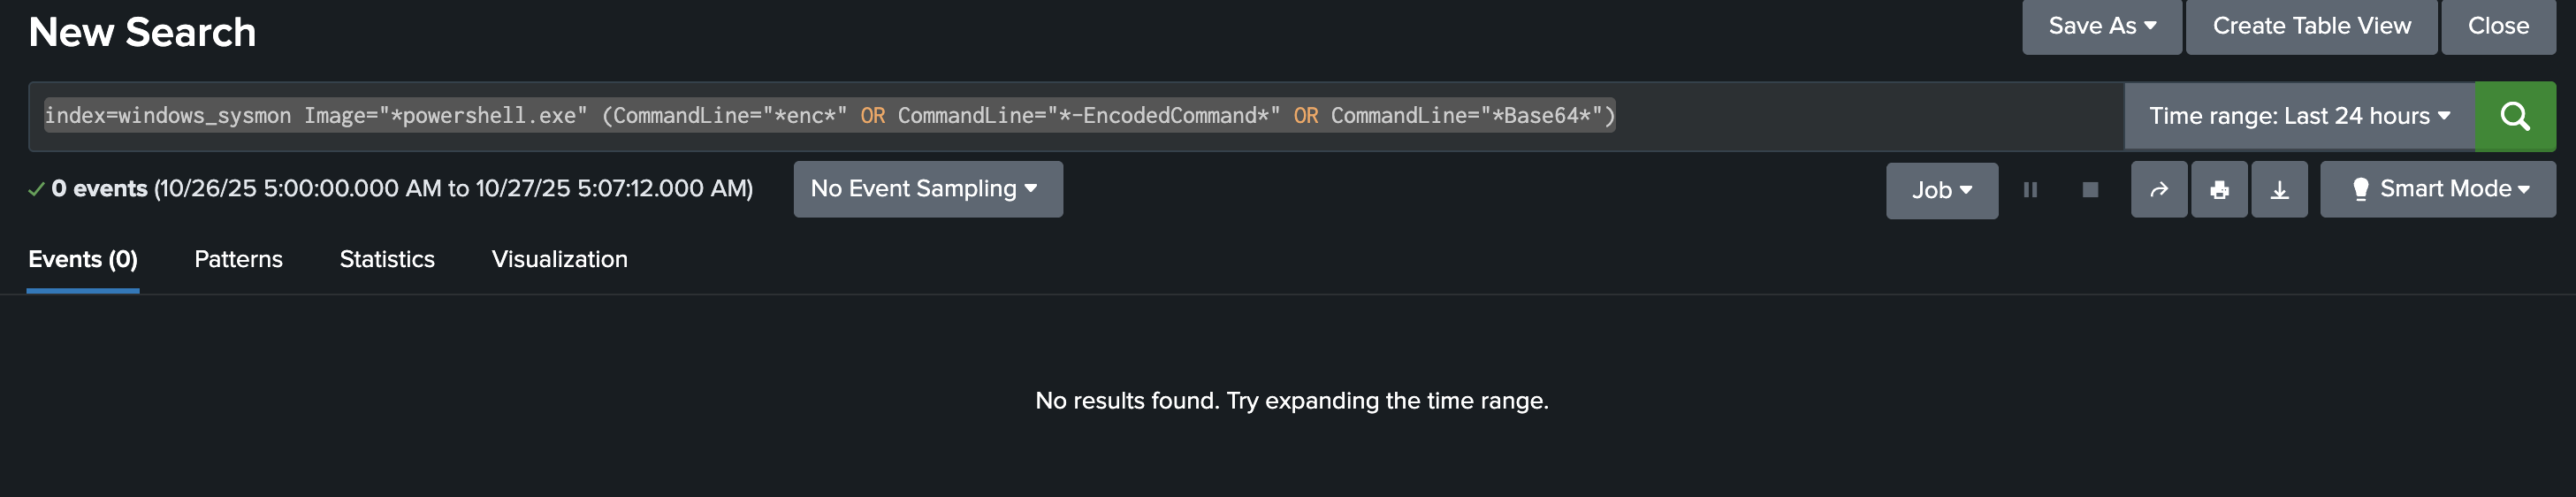
index=windows_sysmon Image="*powershell.exe" (CommandLine="*enc*" OR CommandLine="*-EncodedCommand*" OR CommandLine="*Base64*")
This query detects PowerShell commands containing -EncodedCommand or Base64 text, a common technique attackers use to hide their real commands.
If your defences are correctly configured, this query should return no results, meaning the encoded payload (such as the “Muahahaha” message) never ran.
If results appear, you can decode the Base64 command to inspect the attacker’s true intent.
Answer the questions below
- What is the reconnaissance executable file name?

I set the time and date range to all time to help show events

index=windows_sysmon *cmd.exe* *whoami*

What executable did the attacker attempt to run through the command injection?
index=windows_apache_access (cmd.exe OR powershell OR "powershell.exe" OR "Invoke-Expression") | table _time host clientip uri_path uri_query status

Decoding VABoAGkAcwAgAGkAcwAgAG4AbwB3ACAATQBpAG4AZQAhACAATQBVAEEASABBAEEASABBAEEA on Base64Decode shows us the text below
This is now Mine! Muahaahaa

index=windows_apache_error ("cmd.exe" OR "powershell" OR "Internal Server Error")

index=windows_sysmon ParentImage="*httpd.exe"


This challenge highlights how effective web attack detection depends on correlating events across both the application and the host. Malicious HTTP requests alone do not always confirm compromise, but when paired with Sysmon data showing Apache spawning command-line or PowerShell processes, the picture becomes clear. Splunk’s ability to pivot between these data sources allows defenders to confidently distinguish probing attempts from successful exploitation.
The use of Base64-encoded payloads in the attack demonstrates a common evasion technique designed to bypass simple signature-based detection. However, with proper visibility into command-line execution and process ancestry, even obfuscated activity can be uncovered and decoded. Identifying post-exploitation behaviour such as
whoamiexecution further confirms attacker intent and helps define the scope of compromise.Ultimately, this investigation reinforces the importance of comprehensive logging and correlation in web security. Tools like Splunk empower defenders to trace the full attack chain — from the initial web request to OS-level execution — enabling faster triage, more accurate impact assessment, and stronger defensive improvements against future attacks.
*