Detecting AD Initial Access (TryHackMe)

When people think about Active Directory attacks, they often jump straight to lateral movement and privilege escalation. But before any of that happens, an attacker needs a foothold and in most enterprise environments, that foothold comes through a service that's already exposed to the internet and already trusted by AD.
This TryHackMe room focuses on exactly that: detecting initial access through three of the most common entry points — IIS web applications, Exchange OWA, and VPN gateways. Each one uses a different log source, but the investigation pattern is the same throughout. The attack shows up in the application logs first, and Windows Security events fill in the gaps.
Working through this room, I investigated a web shell deployment, an OWA brute-force (modelled after the real Midnight Blizzard attack against Microsoft in 2024), and a VPN credential attack all in Splunk, correlating IIS logs, Sysmon, NPS events, and Windows Security logs to build the full picture.
Introduction
In an AD environment, every internet-facing service that authenticates against the domain is a potential entry point. This room teaches how to detect initial access attacks against three of the most common ones: IIS web applications, Exchange OWA, and VPN gateways.
Each scenario uses a different application log source, but they share a common principle:
The attack is visible in the application logs first
Then, correlating with other log sources (e.g., Sysmon and Windows Security logs) to reveal the full scope
Learning Objectives
Analyze IIS logs to detect web application attacks and web shell activity
Correlate Exchange/OWA authentication events with Windows Security logs
Investigate VPN credential attacks using NPS event logs
Investigate post-authentication activity to determine the impact of a breach
Build investigation timelines by correlating application logs with Windows Security logs
Prerequisites
Active Directory: How users, groups, and authentication work (Active Directory Basics room)
Windows Event Logs: Reading and filtering Security events (Windows Event Logs room)
Splunk: Writing SPL queries to search and filter log data (Splunk: Exploring SPL room)
AD Monitoring: Understanding the main Event IDs needed to know what's normal in AD to detect abnormal (Monitoring Active Directory room)
Understanding IIS and Its Logs
Why AD Changes the Attack Surface
Consider a standalone web server. An attacker can exploit a vulnerability in the web application, brute-force an exposed login page, or phish an admin for credentials. All of these are serious, but the damage stays on that one machine.
Active Directory changes the equation. In an AD environment, services like web applications, Exchange email, and VPN gateways all authenticate users against the same central directory. Each of these services becomes a potential entry point, not just to the service itself, but to every resource in the domain.
The diagram below illustrates the difference in impact between compromising a standalone server versus a service connected to Active Directory.
We'll see how attacks can occur at the application layer before they ever reach Active Directory.
What IIS Is and Why It Matters
Internet Information Services (IIS) is Microsoft's web server platform. Exchange, SharePoint, ADFS, and many internal business applications all run on IIS. Any of these applications can become an initial access point if an attacker finds a vulnerability to exploit.
When a user logs into an IIS-hosted application, IIS passes the credentials to Active Directory for validation. Windows logs the result as Event 4624 (An account was successfully logged on) or Event 4625 (An account failed to log on). This means IIS authentication generates events in both the IIS access logs and the Windows Security logs on the web server, while the Domain Controller logs Event 4776 for credential validation, as shown in the diagram below.

IIS Log Basics
IIS stores access logs in C:\inetpub\logs\LogFiles\W3SVC1 by default. Each log file contains one line per HTTP request.
Important note: IIS records all timestamps in UTC, regardless of the server's local time zone. This matters when we correlate IIS entries with Windows Security events, which use the machine's local time zone.
Not every field in the log is relevant for us, so here are the ones worth focusing on:
| Field | Description | Why It Matters |
|---|---|---|
| c-ip | Client IP address | Identifies the attacker's source IP |
| cs-uri-stem | URI path requested | Reveals what resource was accessed (web shell paths, admin panels) |
| cs-uri-query | Query string | Can contain commands passed to web shells |
| cs-method | HTTP method (GET/POST) | POST requests to unusual paths are suspicious |
| sc-status | HTTP status code | 200=success, 401=auth failure, 302=redirect (used by OWA) |
| cs(User-Agent) | Browser/tool identifier | Can reveal automated tools (curl, Python), though attackers can spoof it |
We don't need to memorize them as we'll use them in the following investigation tasks.
Normal vs Suspicious IIS Patterns
Before we move on, this table shows what normal IIS traffic looks like compared to patterns that should raise our attention:
| Pattern | Normal | Suspicious |
|---|---|---|
| Authentication volume | A few login events per user throughout the day | Hundreds of login attempts from the same IP in minutes |
| Request timing | 09:15 login from 10.5.10.x (office subnet, business hours) | 03:22 login from 10.99.50.x (unknown subnet, outside hours) |
| URI paths | /owa/, /ecp/, /internalapp/default.aspx | /aspnet_client/system_web/shell.aspx or /uploads/cmd.aspx |
| Query strings | ?ViewAction=ReadMessage&ItemID=AAM | ?cmd=whoami or ?exec=ipconfig |
| HTTP methods | GET for pages, POST for login forms | POST to /aspnet_client/shell.aspx (a static file directory) |
| HTTP status codes | Occasional 404s from typos | Hundreds of 404s from a single IP in minutes (directory scanning) |
When analyzing IIS logs, we should first look for deviations from these normal patterns. For example, a flood of authentication failures from a single IP or POST requests to files in unexpected directories are both red flags and require investigation.
Answer the questions below
Where does IIS store access logs by default? C:\inetpub\logs\LogFiles\W3SVC1
Detecting Web Shell Deployment
Now that we understand how IIS logs work, let's look at what happens when an attacker exploits an IIS-hosted application and deploys a web shell.
A web shell is a malicious script (usually with an .aspx extension in IIS environments) that lets an attacker execute OS commands through HTTP requests. They survive reboots, communicate over normal web ports, and don't require additional tools. A basic web shell can be as simple as a single line:
<%@ Page Language="C#" %><%System.Diagnostics.Process.Start("cmd.exe","/c "+Request["cmd"]);%>
This accepts a command via the cmd parameter in the URL and executes it on the target host.
The diagram below shows the typical web shell attack flow.
To understand the real-world impact, let's look at how threat actors have deployed web shells in the wild.
In March 2021, HAFNIUM chained four Exchange Server zero-days (ProxyLogon) to deploy China Chopper .aspx web shells on tens of thousands of servers, dropping them in C:\inetpub\wwwroot\aspnet_client\ (CISA Advisory AA21-062A). In 2023, CISA reported similar .aspx shells on U.S. government IIS servers via a Telerik UI vulnerability. Different vulnerability, same detection pattern.
The Core Detection Pattern
Web shell activity has a distinct signature in process chains. During normal IIS operation, the worker process w3wp.exe handles HTTP requests and generates responses without launching other processes.
Meanwhile, when an attacker interacts with a web shell, w3wp.exe spawns child processes to execute commands:
When w3wp.exe is spawning cmd.exe, powershell.exe, or tools that it shouldn't spawn, that's almost always worth investigating. Legitimate IIS applications rarely need to launch command shells.
Investigating Web Shell Activity in Splunk
Follow along in the Splunk instance as we walk through each step.
Step 1: Identify Scanning Activity
Before deploying a web shell, attackers scan for writable paths. In IIS logs, this appears as a burst of 404 responses from a single IP:
index=iis sc_status=404
| stats count by c_ip
| sort - count
This activity, hundreds of 404 responses from a single IP address, is almost certainly a directory scanner.
Moving on with the investigation, we can then filter for that IP's successful requests (sc_status=200) to see what they discovered, and use this IP throughout the rest of the investigation.
Step 2: Finding the Suspicious .aspx
Filtering for the IP and HTTP status code using the following query:
Replace {SUSPICIOUS_IP} with the IP you identified in Step 1.
index=iis c_ip={SUSPICIOUS_IP} sc_status=200
| stats count by cs_uri_stem
| sort - count
We found a web shell that stands out, along with other URIs discovered by the attacker.
What stands out here about the webshell is that it's placed into /aspnet_client/. This is a default IIS directory that normally stores ASP.NET client-side scripts and should never contain application code. This folder is writable by the IIS worker process (w3wp.exe), making it a common web shell drop location.
Step 3a: Filter for the Suspicious .aspx
Once we've identified the malicious webshell, we'll filter for it to check its activity and interaction with our system:
Replace {WEBSHELL_FILENAME} with the suspicious .aspx file you found in Step 2.
index=iis cs_uri_stem="*/{WEBSHELL_FILENAME}"
| table _time, c_ip, cs_method, cs_uri_query, sc_status
| sort _time
We can see in the cs_uri_query field the reconnaissance commands the attacker executed via the web shell.
Step 3b: Trace the Process Chain in Sysmon
To know when these commands exactly were executed on disk, we'll pivot to process creation events (Sysmon Event ID 1 or Security Event ID 4688 with command line auditing) to see what processes w3wp.exe spawned.
index=win EventCode=1 ParentImage="*\\w3wp.exe"
| table _time, ParentImage, CommandLine
| sort _time
This query shows every process that w3wp.exe has launched. Here, we see the same reconnaissance commands being executed by w3wp.exe, which were executed by the web shell.
In a normal, clean environment, this query should return very few results.
Tip: You might sometimes find discrepancies between the IIS logs and those on the endpoint itself (e.g., Sysmon or Security events) due to buffered logging and network latency.
Step 4: Find When the Web Shell Was Deployed
To find when the web shell was deployed, we check Sysmon Event ID 11 (FileCreate), which tells us when the file was written to disk:
index=win EventCode=11 TargetFilename="*{WEBSHELL_FILENAME}"
| table _time, Image, TargetFilename
If Sysmon Event ID 11 isn't available in our environment, we can check for POST requests that contain the web shell filename in the cs_uri_query:
index=iis cs_method=POST cs_uri_query="*{WEBSHELL_FILENAME}"
| table _time, c_ip, cs_uri_stem, cs_uri_query, sc_status
| sort _time
One thing to keep in mind. Some legitimate .NET applications cause w3wp.exe to spawn child processes like csc.exe (the C# compiler). That's normal. The distinguishing factor is what commands are being executed.
On the Splunk instance, investigate the web shell activity in the IIS and Sysmon logs.
Answer the questions below
What is the filename of the web shell the attacker used? shell.aspx
index=iis sc_status=404
| stats count by c_ip

index=iis c_ip="203.0.113.47" cs_method=GET

What IP address was used to interact with the web shell? 203.0.113.47
After accessing the web shell, what was the first reconnaissance command the attacker executed? whoami
index=iis c_ip="203.0.113.47" cs_method=GET

Exchange, OWA, and Credential Attacks
Web shell deployment is one way attackers target IIS-hosted applications. But the more common initial access approach is credential attacks against login pages, and Exchange OWA is one of the most targeted in enterprise environments. It's the gateway to corporate email, and it's accessible from the internet by design.
Exchange runs on IIS, so the same w3wp.exe detection pattern catches Exchange exploitation. But this task focuses on credential attacks, because that's what we'll see far more often.
Before we look at credential attacks, we need to be clear about terminology:
Exchange is the server that handles email delivery, calendaring, and contacts.
Outlook is the desktop client application.
OWA (Outlook Web Access) is the browser-based version that runs on IIS.
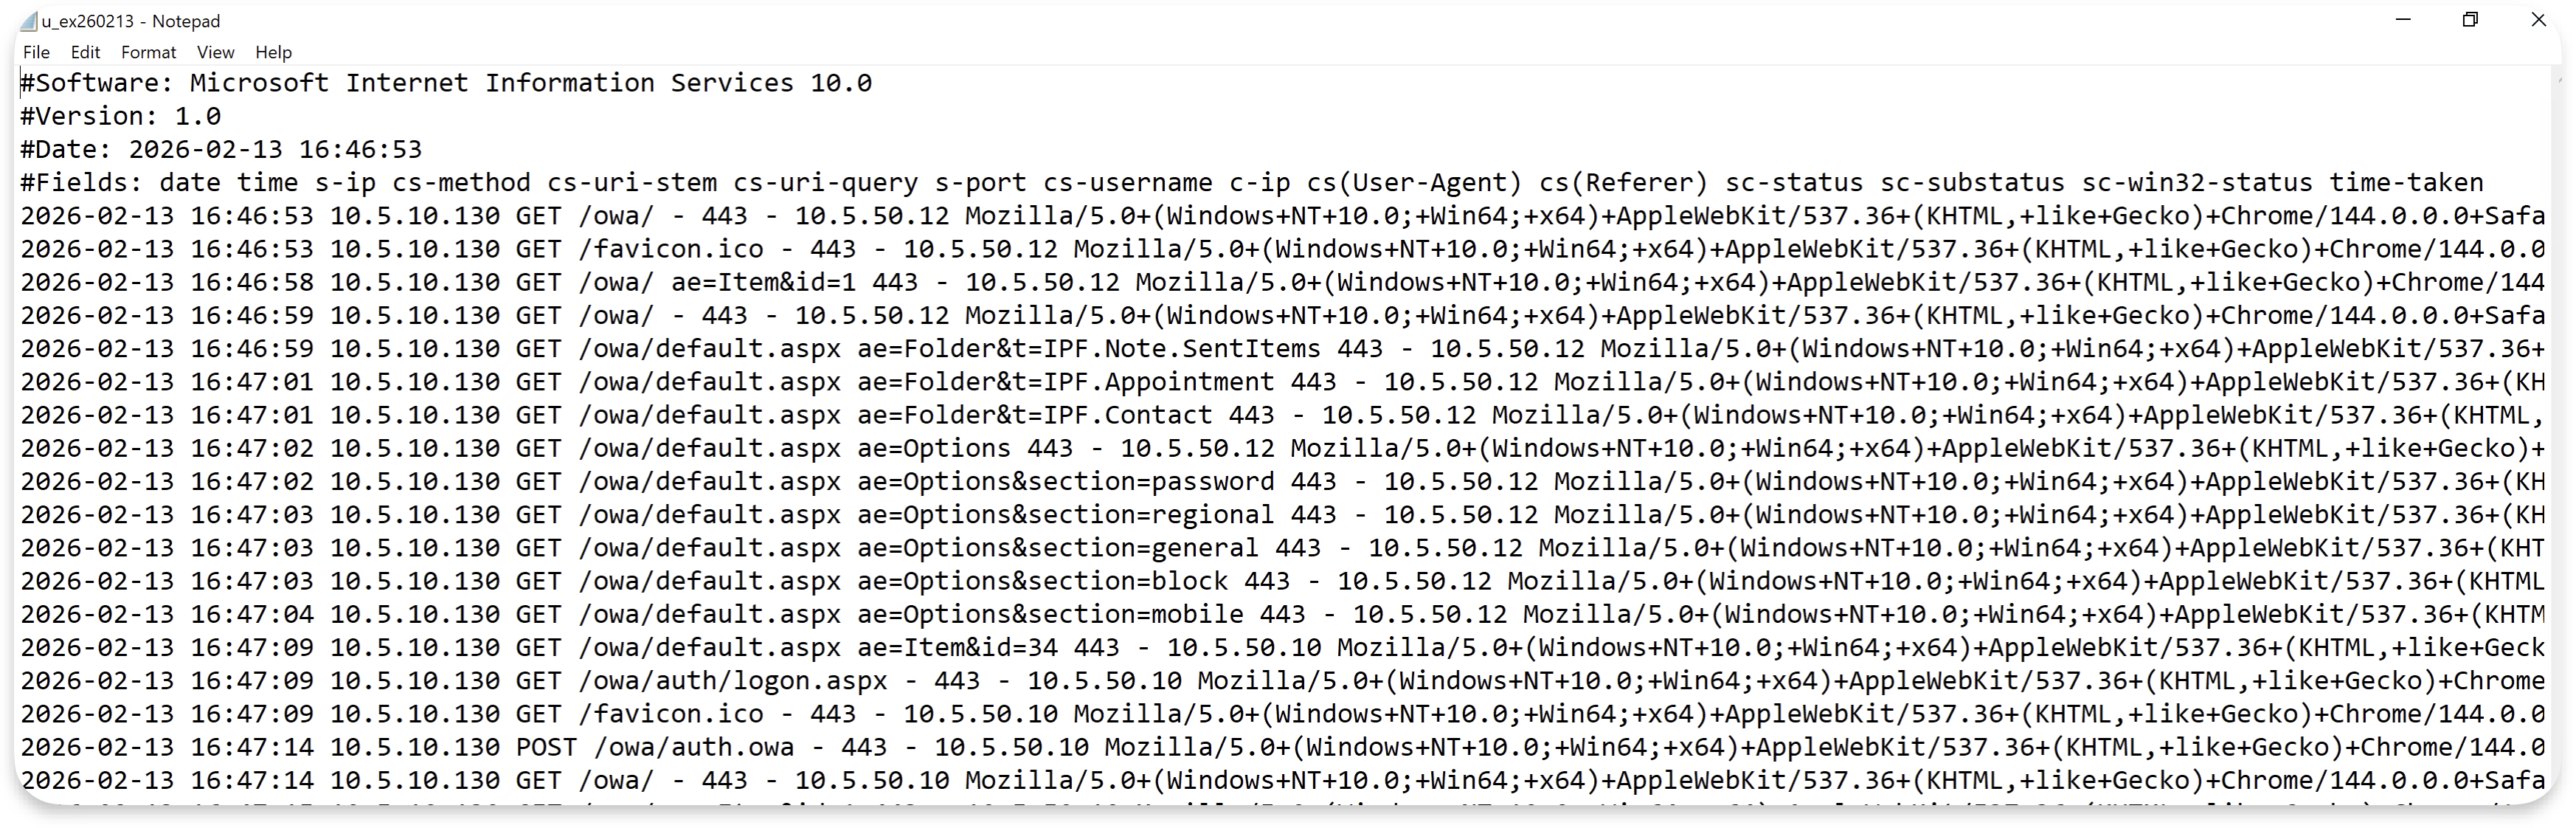
What OWA Looks Like From a Log Perspective
A normal login in modern Exchange servers produces one POST to /owa/auth.owa, a 302 redirect to the inbox, and then GET requests as the interface loads.
A failed login also returns HTTP 302, but redirects back to the login page instead of the inbox. Both outcomes are 302 redirects, so the HTTP status code alone doesn't tell us whether a login succeeded or failed.

The
reason=2in the query string is OWA's way of indicating a failed login.The
urlparameter shows which page the user was trying to reach.
That's where the Windows Security logs come in. Most of the time, when we need the username for an OWA investigation, we pivot to the Windows Security logs, where Event 4624 (successful login) and 4625 (failed login) always capture the account name.
The diagram below shows how IIS logs and Windows Security logs complement each other in an OWA investigation.
Exchange Virtual Directories
For this room, we only need to know two paths:
/owais the Outlook Web Access login page. This is where credential attacks happen./ecpis the Exchange Control Panel, the administrative interface. Access to this path should be rare and monitored closely, because from there an attacker can create forwarding rules, export mailboxes, or modify Exchange settings.
Answer the questions below
What virtual directory path provides access to the Exchange admin console? (Answer Format: /path) /ecp
When investigating an OWA brute-force attack, IIS logs show the attacker's source IP but not the targeted username. Which Windows Event ID should you check to find the targeted account? 4625
Detecting OWA Brute-Force Attacks
In January 2024, Microsoft disclosed that Midnight Blizzard (the actors behind SolarWinds) had used password spraying against Microsoft's own corporate Exchange environment. They compromised a legacy test tenant account that lacked MFA, then used that access to read senior leadership's emails.
Each OWA login attempt generates a POST to /owa/auth.owa. A burst of POST requests to this endpoint from a single IP within a short time window is a brute-force signal. Each failed login also produces Event 4625 in the Windows Security logs, and the successful login produces Event 4624.
Investigating an OWA Brute-Force in Splunk
Follow along in the Splunk instance as we walk through each step.
Step 1: Find Authentication Failures Against OWA
A single IP sending many POST requests to /owa/auth.owa in a short time window is our brute-force signal:
index=iis cs_uri_stem="/owa/auth.owa" cs_method=POST
| bin _time span=5m
| stats count by _time, c_ip
| where count > 10
| sort - count
This same IIS pattern, a burst of POST requests from a single IP, also appears during password spraying attacks. At the IIS level, the two look identical because IIS logs don't capture which account was targeted.
The distinction becomes visible in Step 2, where Windows Security logs (Event 4625) reveal whether failures cluster around one account (brute force) or spread across many accounts (spraying).
Step 2: Identify the Targeted Account
The POST count tells us someone was trying many logins, but IIS logs don't tell us which account was targeted. The cs_username field is typically empty for OWA requests.
To find the targeted account, we pivot to Security logs Event 4625:
index=win EventCode=4625
| stats count by user, Logon_Type
| sort - count
The account with the highest failure count is our brute-force target. Notice the Logon_Type 8 (NetworkCleartext), which is how IIS-hosted applications authenticate against AD.
Step 3: Correlate Logins With Windows Security Logs
To determine how many failed authentication attempts occurred, and whether they successfully authenticated for the targeted user:
Replace {TARGETED_USER} with the account you identified in Step 2.
index=win EventCode IN (4624, 4625) user="{TARGETED_USER}" Logon_Type=8
| table _time, EventCode, user, Process_Name, Logon_Type
| sort _time
We can see a cluster of 4625 entries followed by a 4624 when the attacker succeeded. These events are on the web server itself (not the DC) because IIS handles authentication there.
Warning: The Source_Network_Address in these 4624/4625 events may be empty or show a local address, because the logon is processed locally by IIS. The attacker's real IP is only in the IIS logs, which is why we need both log sources.
Step 4: Check for Post-Authentication Activity
Detecting the brute-force attack is only half the investigation. Let's check IIS to see if the attacker accessed any sensitive Exchange paths:
Replace {ATTACKER_IP} with the source IP from the brute-force attack.
index=iis c_ip="{ATTACKER_IP}"
| stats count by cs_uri_stem
| sort - count
If we see requests to endpoints like /ecp (the Exchange admin panel) or /powershell (Exchange Remote PowerShell), this means the attacker was escalating beyond email access.
This would be the pivot point for further investigation to uncover the rest of the attack.
On the same Splunk instance, investigate the OWA brute-force attack using the IIS and Windows Security logs.
Answer the questions below
How many failed login attempts occurred during the OWA brute-force attack? 15
index=win EventCode=4625
| stats count by user, Logon_Type
| sort - count

What username was successfully compromised in this attack? sarah.kim
What source IP address conducted this brute-force attack? 203.0.113.47
After the successful login, what path did the attacker access to reach the Exchange admin console? (Answer Format: /path) /ecp
VPN and Active Directory
So far, we've been working with IIS logs to detect attacks against web applications and Exchange. VPN is different.
The VPN gateway is usually a non-Windows appliance (Fortinet, Cisco, Palo Alto, Ivanti), so detection shifts from web server logs to authentication logs. But the principle is the same, where VPN authenticates against AD. So, compromising a VPN account means compromising an AD account.
The VPN Authentication Flow
In most enterprise environments, the VPN gateway doesn't communicate directly with AD. It uses the RADIUS protocol as an intermediary. On Windows, the RADIUS server is called NPS (Network Policy Server).
The authentication flow is as shown in the following diagram:
NPS events only appear when the VPN gateway is configured to use RADIUS. Some environments configure VPN gateways to authenticate directly against AD via LDAP, in which case, there are no NPS events. Detection then relies on Event 4624/4625 on the VPN gateway itself, and Event 4776 on the DC for credential validation.
NPS Event IDs
| Event ID | Meaning | Security Relevance |
|---|---|---|
| 6272 | Network Policy Server granted access | Successful VPN authentication |
| 6273 | Network Policy Server denied access | Failed VPN authentication |
| 6274 | Network Policy Server discarded the request | Malformed or rejected request |
Event 6273 includes a Reason Code field:
| Reason Code | Meaning | What It Tells Us |
|---|---|---|
| 16 | Unknown user name or bad password | Credential attack indicator |
| 48 | No matching network policy | Account not authorized for VPN (not an attack) |
| 65 | RADIUS shared secret mismatch | Misconfiguration (not an attack) |
Reason code 16 indicates a credential attack. Reason codes 48 and 65 are configuration issues. Knowing the difference prevents misinterpreting legitimate failures as attacks.
Normal vs Malicious VPN Activity
Legitimate VPN usage follows predictable patterns such as users authenticating during business hours, from expected locations, and accessing a consistent set of internal resources. Occasional failures are typical (mistyped passwords), appearing as isolated NPS 6273 events.
What stands out is clustered failures. Ten or twenty NPS 6273 events in rapid succession targeting the same username isn't someone mistyping their password.
Ransomware groups like Akira use exactly this approach to gain their initial foothold. According to CISA's advisory, Akira actors have gained access by brute-forcing VPN endpoints, using password spraying tools, or purchasing credentials from initial access brokers. In some incidents, they exfiltrated data within just two hours of gaining initial access.
Brute Forcing Is Not Always the Case
As the CISA report shows, brute forcing isn't the only way attackers gain VPN access. Credentials might come from an initial access broker, a vulnerability in the VPN product itself, or a password spraying campaign that succeeded elsewhere.
And if the attacker already has the correct password, the result is a single NPS 6272 event with no preceding failures. That looks identical to a legitimate login.
In that case, detection relies entirely on what occurs after authentication: which hosts the user connects to, what resources they access, and whether any of that deviates from their normal behavior.
Answer the questions below
What Windows Event ID indicates that NPS granted network access to a VPN user? 6272
In a typical enterprise VPN deployment, what protocol does the VPN gateway use to communicate authentication requests to NPS? RADIUS
Detecting VPN Credential Attacks
This is the third and final investigation scenario. We'll follow the same methodology, but the only difference is the log source: NPS instead of IIS.
Investigating a VPN Credential Attack in Splunk
Step 1: Identify the Scope of the Attack
Start by looking at NPS denial events:
index=win EventCode=6273
| stats count by User_Account_Name, Client_IP_Address
| sort - count
This shows which usernames were targeted and which RADIUS client IPs they originated from. The Client_IP_Address identifies the VPN gateway that forwarded the request, not the actual IP that authenticated to the VPN.
Step 2: Find the Compromised Account
To check whether this user successfully authenticated afterwards:
Replace {COMPROMISED_USER} with the account you identified in Step 1.
index=win EventCode IN (6273,6272) User_Account_Name={COMPROMISED_USER}
| table _time, EventCode, User_Account_Name, Client_IP_Address
This is a suspicious pattern that might indicate a brute-force attack.
Step 3: Correlate With Security Logon Events
We can also correlate this authentication result with Windows Security logs Event 4624/4625:
Replace {COMPROMISED_USER} with the same account from Step 2.
index=win EventCode IN (4624, 4625) user={COMPROMISED_USER}
| table _time, host, user, EventCode, Logon_Type
| sort _time
When NPS validates credentials, it authenticates the user against Active Directory. Since NPS runs on THM-DC in our lab, it creates a logon session locally, generating Event 4625 for each failed attempt and Event 4624 for the successful one on the same machine.
We can see a cluster of 4625 entries followed by a 4624. The timestamp should closely match the NPS 6272 from Step 2.
These Security events are useful because they include the LogonId, which lets us trace the user's session activity after authentication.
Info: In our lab, NPS runs on THM-DC, so the logon session events (4624/4625) appear directly on the Domain Controller. In a production environment where NPS runs on a separate server, these 4624/4625 events would appear on the NPS server instead. The DC would log Event 4776 (Credential Validation) for each authentication attempt, because the DC only validates the password without creating a local logon session for that user.
Now that we've walked through the VPN investigation, on the same Splunk instance, answer the following questions based on what we found.
Answer the questions below
What username was successfully compromised via VPN after the credential attack? david.chen
index=win EventCode=6273
| stats count by User_Account_Name, Client_IP_Address
| sort - count

Based on the NPS access-accept event, at what time did the successful VPN authentication occur? (Answer Format: HH:MM:SS) 10:47:06
index=win EventCode IN (6272) david.chen
| table _time, EventCode, User_Account_Name, Client_IP_Address

Investigation Challenge
Answer the questions below
What is the filename of the web shell the attacker deployed? error.aspx
index=* sc_status=404
| stats count by c_ip
| sort - count
index=* c_ip="198.51.100.23" cs_method=GET sc_status=200

What was the first reconnaissance command the attacker executed through the web shell? hostname

What URI path was used to upload the web shell to the server? (Answer Format: /path/file.ext) /internalapp/upload.aspx
The previous question answers this question as well, you'll see the upload.aspx file path. The next question is reliant on this answer that's why you see the image attached

At what time was the web shell file created on the server? (Answer Format: HH:MM:SS) 10:40:33
index=* /internalapp/upload.aspx
Conclusion
This room covered three attack surfaces, three application log sources, and a consistent investigation approach. Every service we looked at, whether it was IIS, Exchange, or VPN, authenticates against Active Directory. And every attack left traces in both the application logs and the Windows Security logs.
Takeaways
IIS logs capture source IPs, URI paths, and request patterns that Windows Security events miss, making them essential for detecting web shell interaction and credential attacks against OWA.
The
w3wp.exespawningcmd.exeorpowershell.exepattern catches web shell activity regardless of the vulnerability exploited.NPS Events 6272/6273 exhibit the same failed/succeeded pattern for VPN authentication as IIS does for web applications, so the investigation methodology transfers directly.
VPN credential attacks aren't always brute force. Stolen credentials produce no failure cluster, making post-authentication activity the primary detection opportunity.
Correlation across application logs, Windows Security events, and post-authentication checks on internal hosts builds the complete picture from initial attack to impact.
The
Logon_Typefield in Event 4624 helps work backwards from AD alerts: Type 8 points to IIS, Type 3 from unexpected sources can indicate VPN compromise.
The biggest takeaway from this room isn't any single query — it's the methodology. Whether you're looking at IIS, Exchange, or VPN, the pattern holds: application logs give you the attacker's IP and behaviour, Windows Security logs give you the account, and correlating both gives you the timeline.
A few things that stuck with me: the w3wp.exe spawning cmd.exe detection is surprisingly reliable as a web shell signal regardless of how the shell got there. And the OWA investigation reminded me why MFA on legacy accounts matters — the Midnight Blizzard breach started with a test tenant account that had none.
These aren't theoretical scenarios. The ProxyLogon web shells, the Midnight Blizzard password spray, Akira's VPN brute-forcing — they're all documented incidents. Getting comfortable with this detection workflow in a lab environment is how you build the muscle memory to catch it in the real thing.