Data Exfiltration Detection (TryHackMe)

Search for a command to run...
No comments yet. Be the first to comment.
Link to the challenge on TryHackMe: Modern Web Stacks Introduction During a time-boxed engagement, the first tester to identify Apache/2.4.49 in a Server: header already knows the exact CVE before the
Link to the challenge/walkthrough on TryHackMe: Broken Authentication Introduction Authentication is the process by which a web application verifies the identity of the user making a request. It typic
Link to the HealthGPT AI security CTF challenge on TryHackMe. Meet HealthGPT, a well-meaning virtual assistant used by a busy healthcare team. It helps clinicians look up procedures, draft notes, and

Link to the section of the AI Odyssey CTF on TryHackMe: Token City. It covers challenges like: ML Sec: The Loan Arranger | AI Sec + DFIR: Rogue Commit | AI Sec + Web App Sec: Sealed Substation | Agent
Link to the Privilege Escalation Challenge on TryHackMe: Linux Privilege Escalation: Automation Introduction By now, you should have an understanding of basic privilege escalation techniques and how t
Data exfiltration is the final and often most damaging stage of a cyberattack — the moment sensitive information leaves the organization's control. Whether through DNS tunneling, HTTP POST requests, FTP transfers, or even ICMP echo packets, attackers have developed creative ways to move data out while blending into legitimate network traffic. This writeup walks through the TryHackMe Data Exfiltration room, where I analyzed packet captures and Splunk logs to detect four distinct exfiltration channels. The room reinforces a core SOC principle: no single alert tells the full story — effective detection requires correlating host, network, and log telemetry together.
Data exfiltration is the unauthorized transfer of sensitive data from a computer or other device. It's a primary objective for attackers who have breached a network. As a SOC analyst, our job is to detect and stop this before sensitive information walks out the door. This room will cover the common techniques attackers use to steal data and, more importantly, how we can catch them in the act.

In this room, we will cover the following learning objectives:
Understand the common methods used for data exfiltration.
Learn how to detect exfiltration attempts using network traffic analysis.
Identify signs of exfiltration on endpoint devices.
Correlate logs in a SIEM to uncover hidden exfiltration channels.
This room expects the users to have covered or explored the following rooms:
All files required to complete the room are placed in the data_exfil folder on the Desktop. The log files for the investigation's coming tasks are pre-ingested into the Splunk Instance, which can be accessed from within the Machine at MACHINE_IP:8000.
For the practical lab, there are three ways to approach the practical:
Explore the network traffic in the respective folder in the data_exfil directory on the Desktop.
Perform Log Analysis on the log file in the same folder.
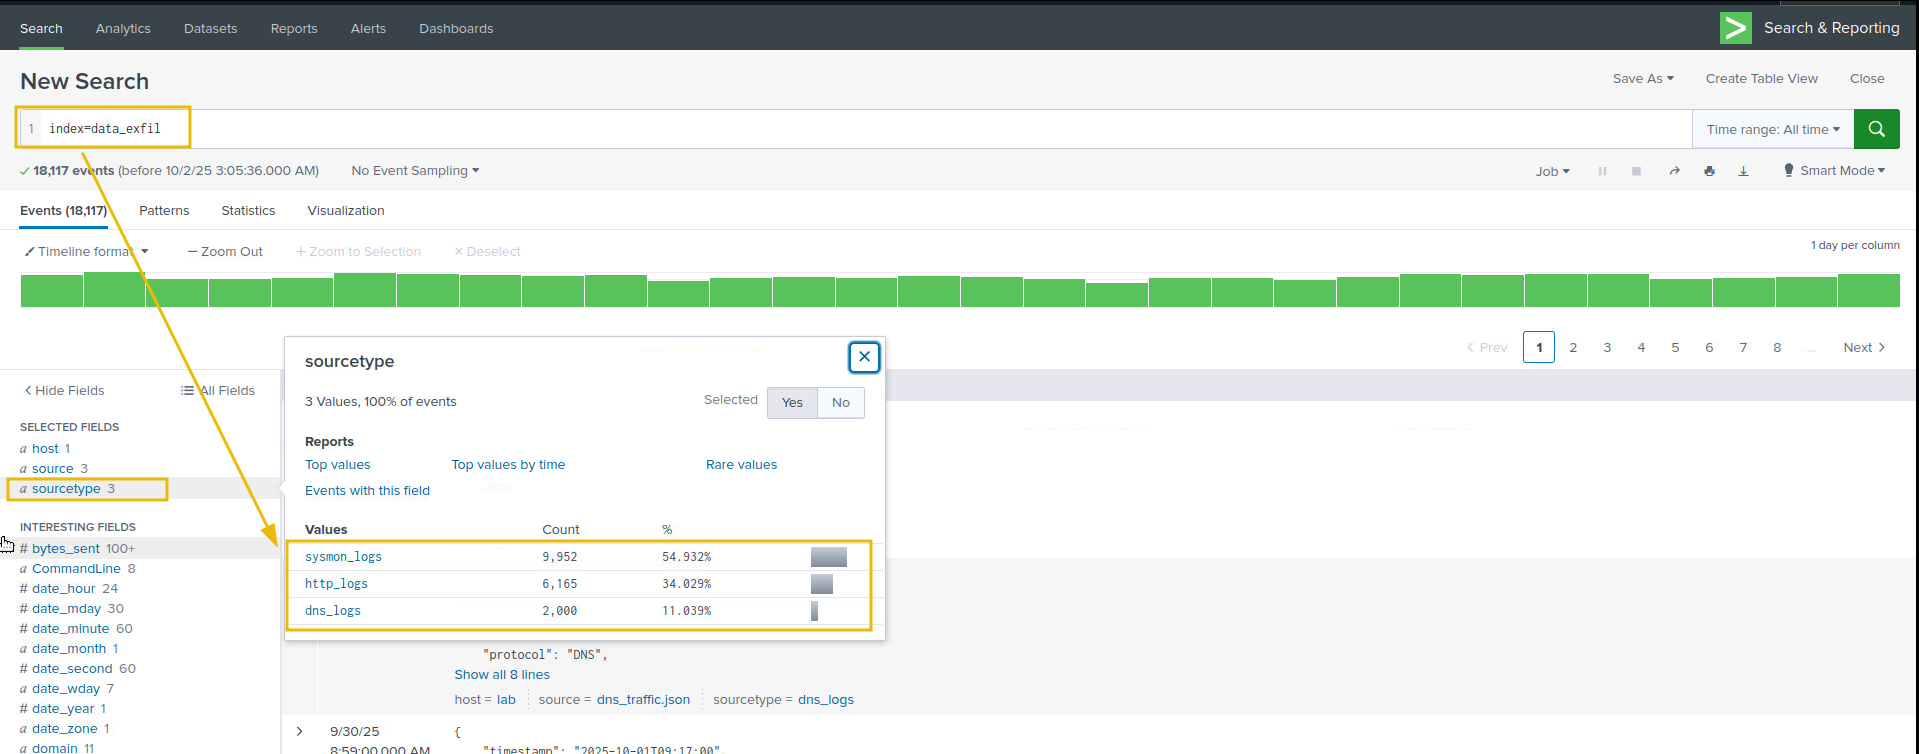
Examine the logs already ingested into the Splunk instance. Make sure to select All times and use the index=data_exfil, as shown below:
Data exfiltration is the unauthorized transfer of data from an organization to an external destination controlled by an adversary. It can be deliberate (insider) or via malware / compromised credentials.
Data exfiltration is the act of stealing sensitive information from a network. Adversaries do this for several reasons:
Financial Gain: Stolen data (e.g., credit card info, personal records) can be sold on the dark web or used for fraud.
Espionage: Nation-state actors target intellectual property, trade secrets, or classified data for strategic advantage.
Ransomware & Extortion: Attackers steal data and threaten to leak it unless a ransom is paid.
Disruption & Sabotage: Some adversaries aim to damage reputations or operations by leaking internal data.
Persistence & Reconnaissance: Exfiltrated data helps attackers understand the environment for future attacks.
The following table covers some of the real-world threat actors and their data exfiltration methods.
| Threat Actor / Campaign | Exfiltration Technique | Description |
|---|---|---|
| APT29 (Cozy Bear) | HTTPS over legitimate domains | Encrypted HTTPS channels were used to exfiltrate data from government networks. |
| FIN7 | HTTP POST to C2 servers | Embedded stolen data in HTTP POST requests to evade detection. |
| Lunar Spider (Zloader) | Encrypted C2 channels | Maintained a two-month intrusion using encrypted channels and staged exfiltration. |
| DarkSide Ransomware | Dual extortion: encryption + exfil | Stole data before encrypting systems, then threatened public leaks. |
| APT10 (Cloud Hopper) | Cloud-to-cloud transfer | Exfiltrated data from managed service providers using cloud APIs. |
Discovery / Collection: attacker locates sensitive files.
Staging / Compression: attacker aggregates, compresses, encrypts, or encodes files (ZIP, RAR, 7z, tar, base64, steganography).
Exfiltration transport: transfer over network, removable media, cloud, or covert channels.
Command & Control (C2) coordination: orchestrates transfer and confirms receipt.
Detecting exfiltration requires correlating host and network-level indicators such as unusually large or frequent outbound uploads (proxy/firewall), long or high-entropy DNS queries, suspicious process command-lines and network connections (Sysmon/EDR), cloud storage API activity, removable-media events, and effective SOC L1 triage focuses on source host/user, destination, transferred volume, process identity/command-line, and supporting evidence across proxy, DNS, flow, host, and cloud logs.
| Techniques | Examples | Indicator of Attack & where to look |
|---|---|---|
| Network-based | HTTP/HTTPS uploads to S3/Azure Blob/webmail, FTP/SFTP/SCP, DNS tunnelling, ICMP/covert protocols, custom TCP/UDP. | Proxy/web gateway logs (large POSTs, uploads to cloud endpoints), firewall/NGFW flows (high bytes to single IP/ASN), netflow (spikes/outbound flows), DNS logs (long hostnames, TXT queries). |
| Host-based | Powershell/Invoke-WebRequest, rclone, awscli, curl/wget, archive creation (zip/rar), use of removable USBs, ADS/hidden streams. | Sysmon/EDR (Process Create, Network Connect, File Create events), Windows Security (4663/4656 object access), auditd/shell history on Linux, and removable-media events. |
| Cloud exfiltration | S3 PutObject / multipart upload, Azure Blob uploads, Google Cloud Storage objects. Insert, Drive/SharePoint external sharing. | CloudTrail / Azure Activity / GCP Audit, cloud storage access logs, unusual service-account or IP activity. |
| Covert & encoding | DNS tunnelling, base64 or chunked encoding, steganography into images/audio, splitting files into many small requests (low-and-slow). | DNS logs, proxy logs with many small POSTs, correlation of intermittent uploads + suspicious process activity. |
| Insider & collaboration tools | Slack/Teams/Dropbox/Google Drive/Box uploads or sharing to external users; compromised employee accounts. | Audit logs (share events, file downloads), and mail logs. |
| General IoAs & triage signals | A large outbound volume to external IPs/domains, unknown destination domains, suspicious processes/command lines, many file read events followed by an outbound connection, and multipart/streamed uploads. | Correlate: Proxy/Firewall/Netflow, DNS, Sysmon/EDR (EventID 1/3/11), mail server logs. |
Data exfiltration is a high-impact threat that combines opportunistic methods, legitimate tools, and creative covert channels to move sensitive assets outside an organisation. An effective detection depends less on single-point alerts and more on rapid correlation across host, network, and cloud telemetry, identifying who accessed data, what was transferred, how it was staged, and where it was sent.
In the coming tasks, we will explore various techniques employed by adversaries to perform data exfiltration and what indicators can help us trace the footprints of the attack.
Exfiltrating the data through HTTP comes under which technique? Network-based
DNS exfiltration abuses the Domain Name System, a protocol normally allowed through networks, to smuggle bytes encoded inside DNS queries/responses so firewalls and web proxies don't notice. Because DNS is typically allowed and often unfiltered or forwarded to public resolvers, it's attractive for covert channels.
DNS (Domain Name System) translates human-friendly domain names (e.g., example.com) into IP addresses and provides other record types (A, AAAA, TXT, MX, CNAME, etc.). Key points:
DNS queries are ubiquitous: almost every host performs DNS lookups.
DNS is normally allowed through firewalls and gateways, making it an attractive covert channel.
DNS uses UDP (mostly) on port 53 for queries and responses; TCP is used for zone transfers or large responses.
Why attackers use DNS for exfiltration:
Always-on service: DNS lookups are routine and often allowed outbound.
High cover: queries look like normal requests unless inspected closely.
Flexible payload: data can be encoded into the subdomain labels or TXT responses.
When analysing DNS traffic for possible indicators of data exfiltration, we should look for:
Many DNS queries are sent to a single external domain, especially with very high counts compared to the baseline.
Long subdomain labels or unusually long full query names (> 60–100 characters).
High entropy or Base32/Base64-like patterns in the query name (lots of mixed case letters, digits, -, = signs for base64).
Rare record types (TXT, NULL) or many large TXT responses.
Unusual response behavior: frequent NXDOMAIN (if attacker uses exfil-by-query without answering), or TCP/large UDP fragments for DNS.
Queries at regular intervals (beaconing behaviour).
Let's use this knowledge and examine the network traffic dns_exfil.pcap placed at /data_exfil/dns_exfil/ on the desktop:
Below are Wireshark display filters, tshark commands, and what to look for when analyzing dns_exfil.pcap.
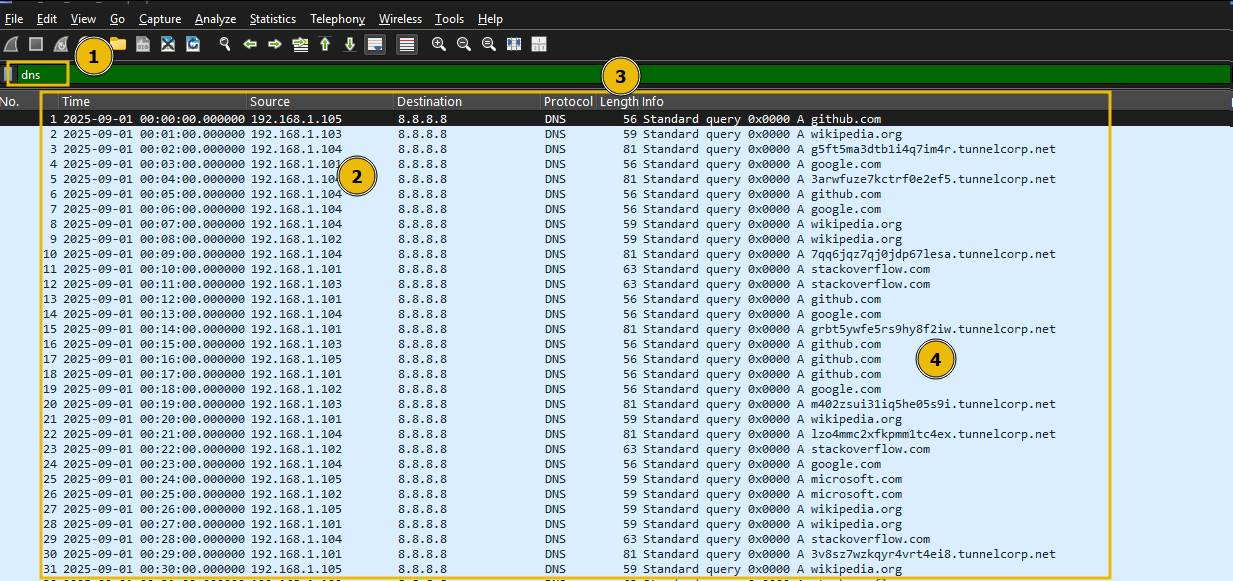
Let's start by applying filter on dns traffic, using the following filter, as shown below:
Filter: dns
Let's filter on the DNS queries with no response using the following filter:
Filter: dns.flags.response == 0
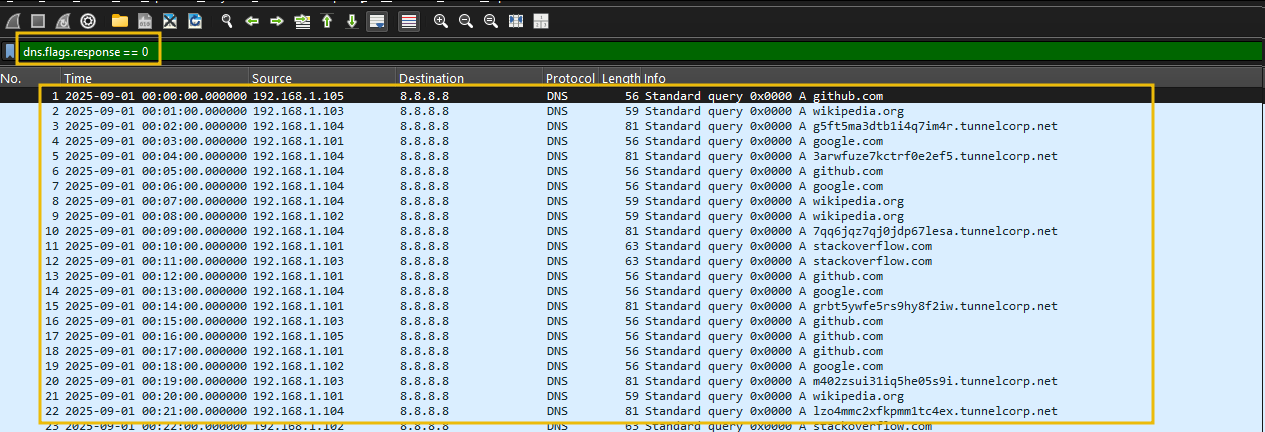
We can see some DNS entries with a large query length.
Let's apply filter on the query length and see if we can narrow down our results.
Filter: dns && frame.len > 70
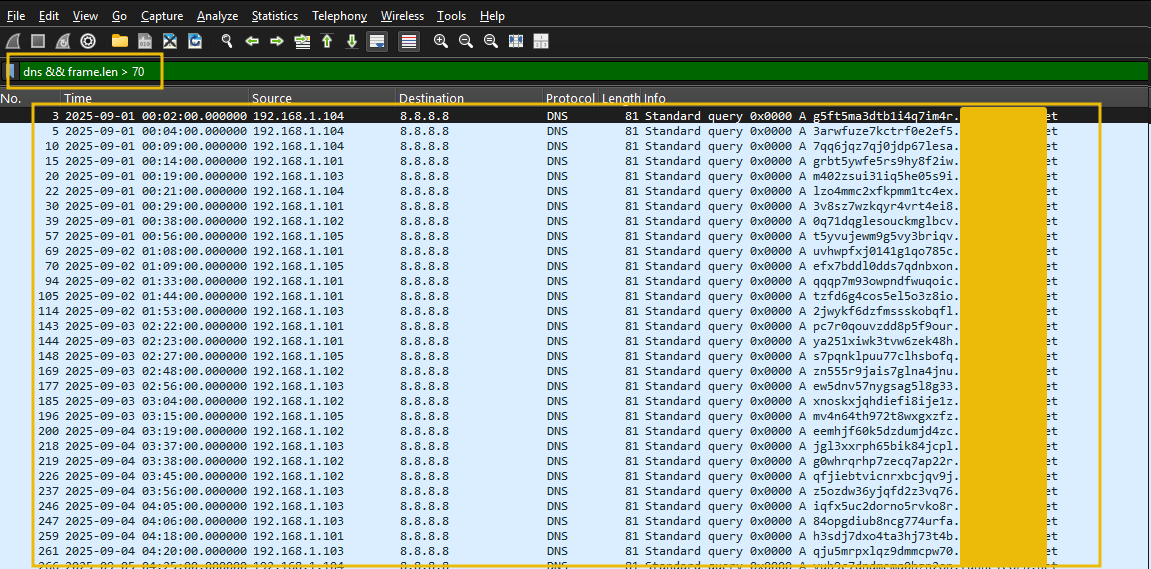
The above result identifies one particular suspicious domain, which is receiving these suspicious-looking DNS requests. Let's filter on the suspicious domain using the following filter:
Filter: dns && dns.qry.name contains <REDACTED>
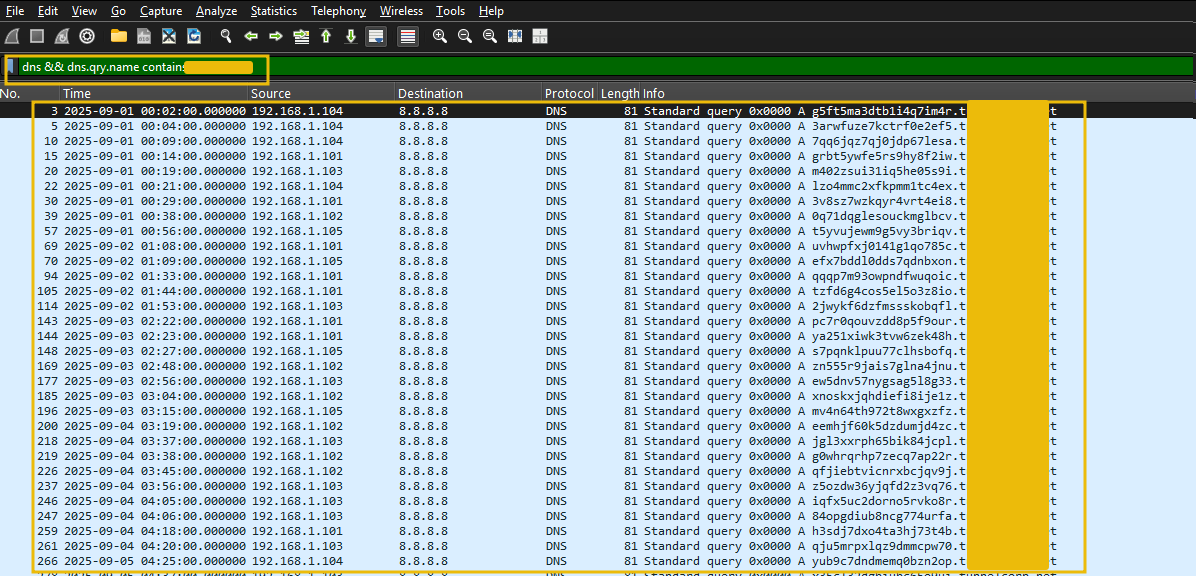
Looks like we have successfully identified the DNS tunneling attempt. From the network traffic, we can observe:
Multiple internal hosts are compromised.
All these hosts are sending the data in chunks using DNS tunneling techniques.
There is only one external domain identified as the one receiving the DNS queries.
Let's correlate this using Splunk.
Open the splunk instance. In the search bar, enter the following search query.
Search Query: index=data_exfil sourcetype=DNS_logs
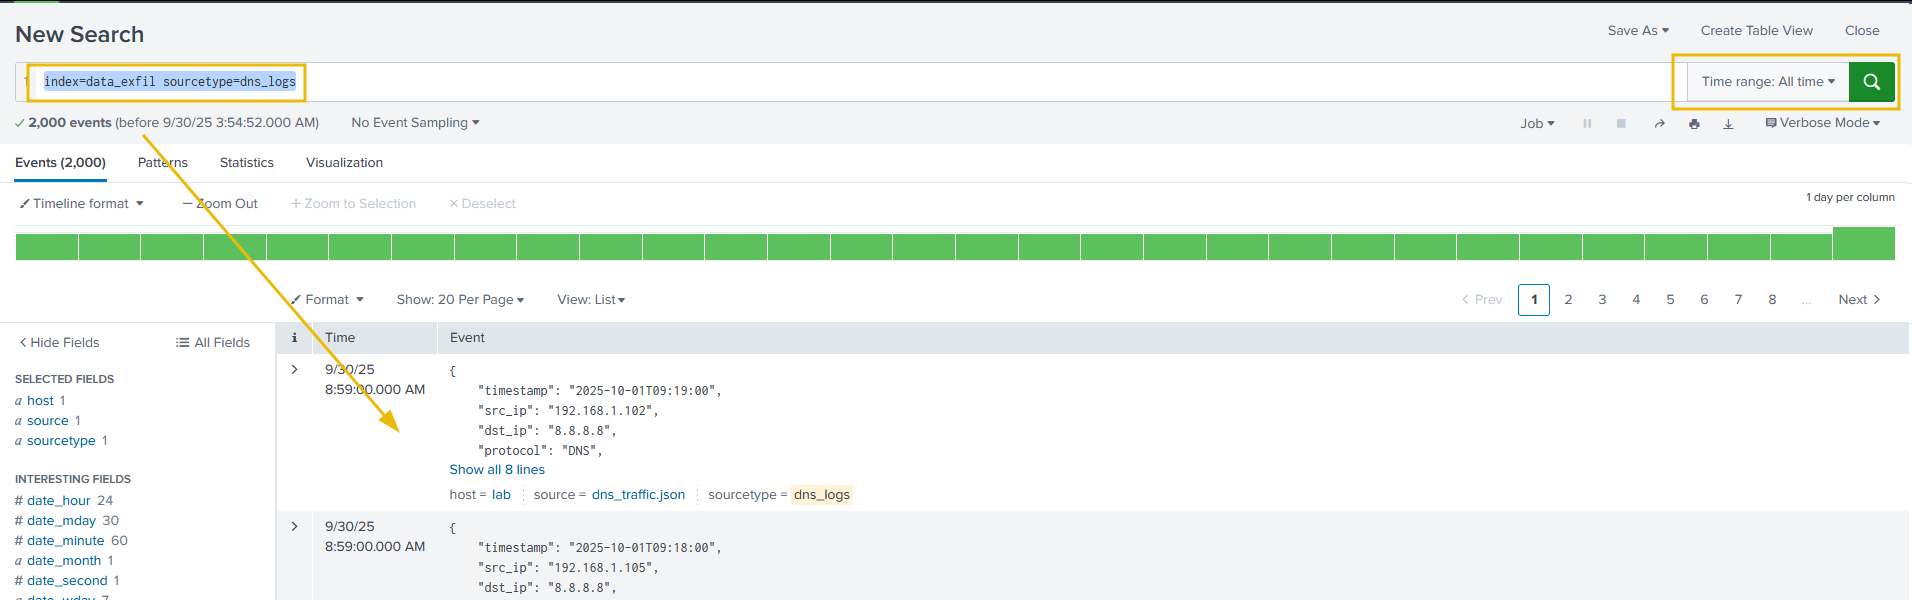
This search query will filter show the results matching sourcetype=DNS_logs.
What to look for
In the DNS logs, we need to look at the suspicious looking domains with a huge query count from multiple hosts or from one host (suspicious if the domain is untrusted).
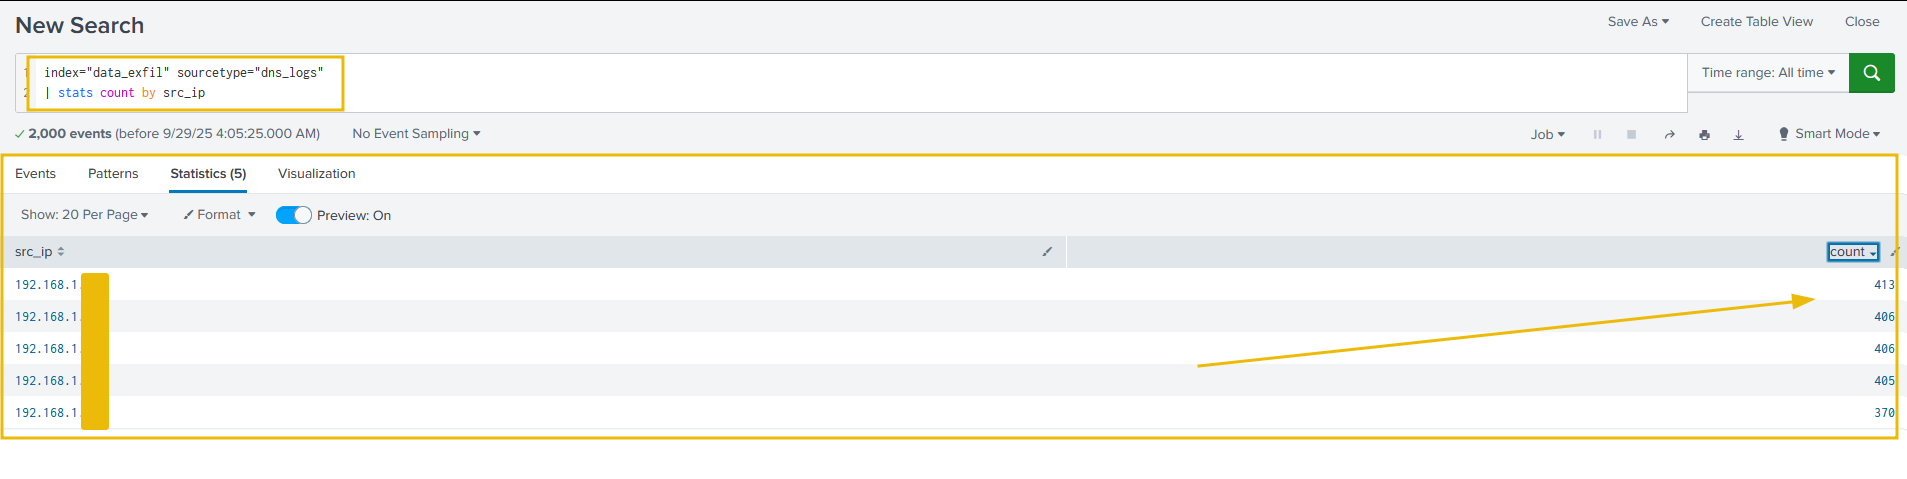
Let's run the following search query to display the stats of DNS queries generated per source IP, as shown below:
Search Query: index="data_exfil" sourcetype="DNS_logs" | stats count by src_ip
Let's now apply filter on the stats of the queries to identify the suspicious ones, as shown below:
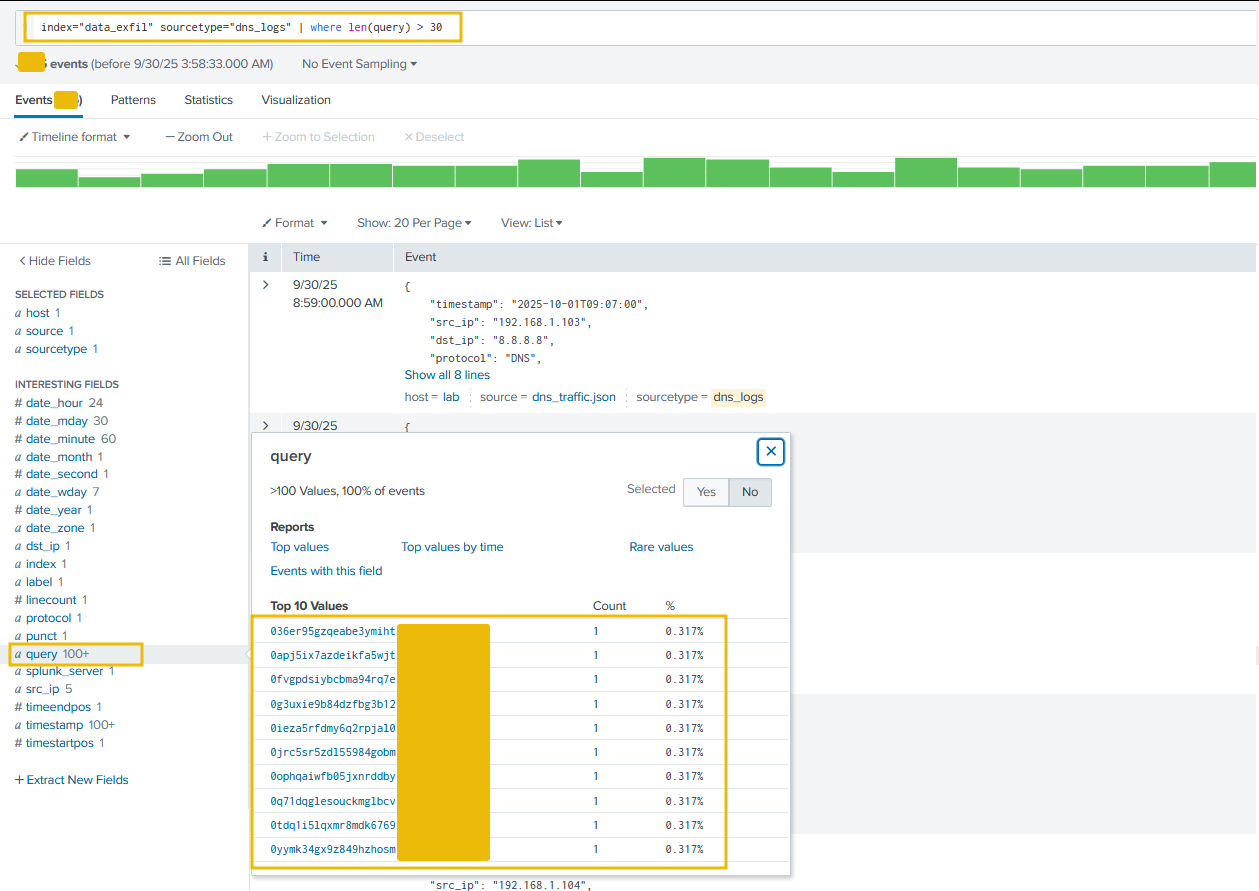
Search Query: index="data_exfil" sourcetype="dns_logs" | stats count by query | sort -count
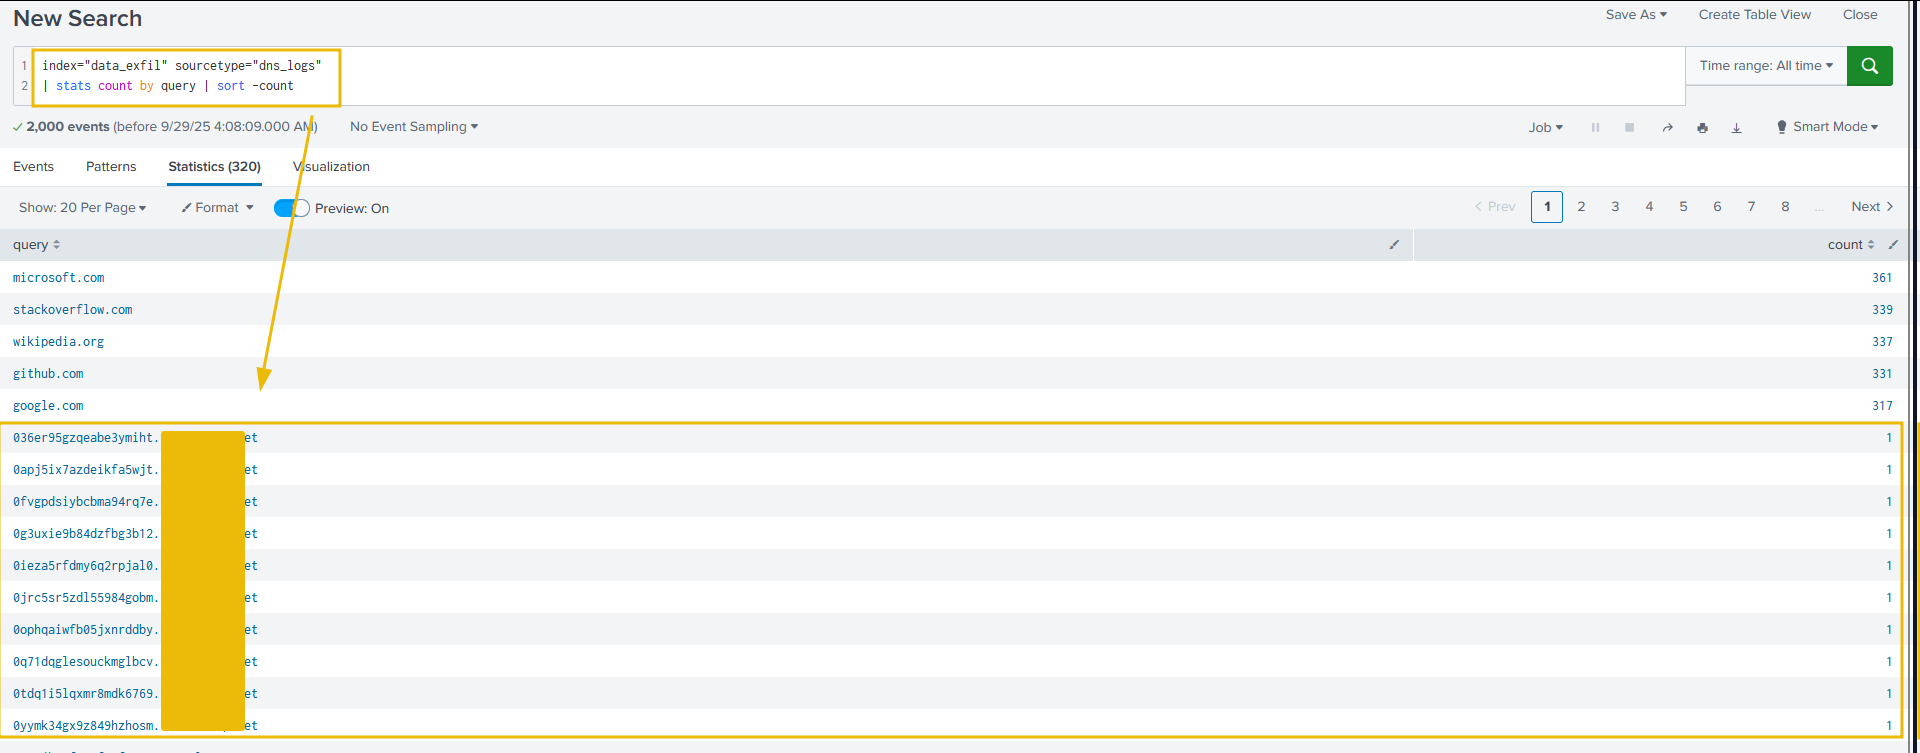
The above results, clearly display some odd looking DNS queries with the a large size of the query.
What to look for:
We can look at single hosts generating far more DNS requests than normal.
Let's now apply the following filter on the queries with length over 30 and see if we can filter the odd-looking ones out, as shown below:
Search Query: index="data_exfil" sourcetype="DNS_logs" | where len(query) > 30
Perfect. With the following indicators, we were able to identify the data exfiltration attempts through DNS tunneling:
A Large number of DNS requests with no response.
Large length of the DNS query.
Let's move on to the next task and learn how to detect the data exfiltration attack via FTP protocol.
What is the suspicious domain receiving the DNS traffic? tunnelcorp.net

How many suspicious traffic/logs related to dns tunneling were observed? 315

Which local IP sent the maximum number of suspicious requests? 192.168.1.103

FTP (File Transfer Protocol) is one of the oldest protocols for transferring files between a client and server over a TCP/IP network. Attackers use it to move large amounts of data off a network, sometimes via compromised credentials, misconfigured servers, or ephemeral accounts. Detection relies on a mix of packet inspection (FTP only), server logs, SSH session metadata, and network flow/size/pattern analysis.
Use legitimate FTP servers (public or misconfigured internal servers) to stage/transfer data.
Use compromised credentials (service accounts, user creds).
Use non-standard ports or tunneling to blend with other traffic.
What to look for:
USER and PASS commands (cleartext credentials).
STOR (upload) and RETR (download) commands: repeated or large transfers.
Large data connections to unusual external IPs, especially outside business hours.
Data channel openings on ephemeral ports (PASV) paired with large payloads.
Let's examine the ftp-lab.pcap file placed in the /data_exfil/ftp_exfil/ on the Desktop. Open the file in Wireshark, and follow the steps mentioned below:
Isolate FTP control & data
First, we will look for FTP Sessions using the ftp || ftp-data filter, as shown below:
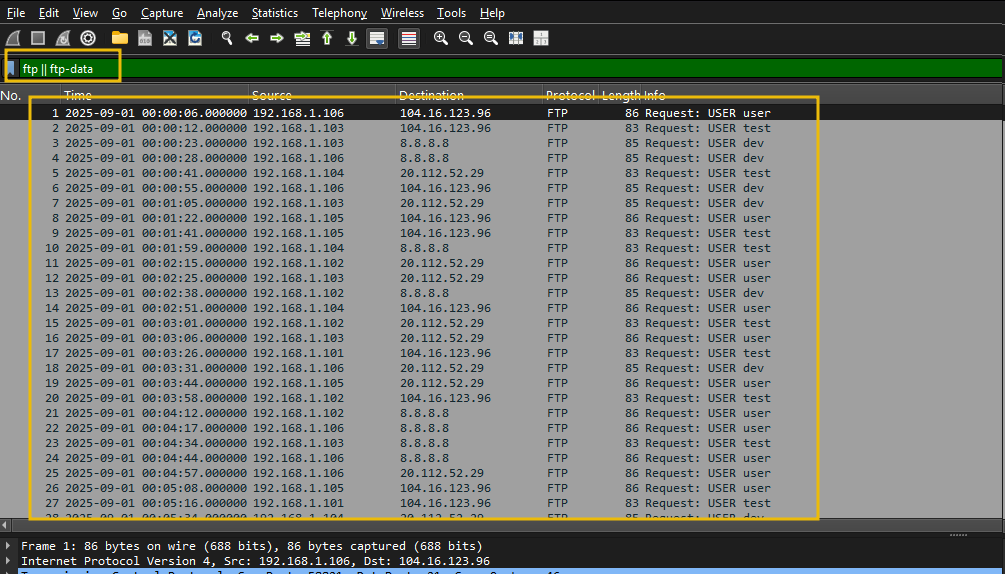
This filter will isolate the ftp control traffic.
Look for Credentials
Let's filter to show only login attempts with USER/PASS:ftp.request.command == "USER" || ftp.request.command == "PASS"
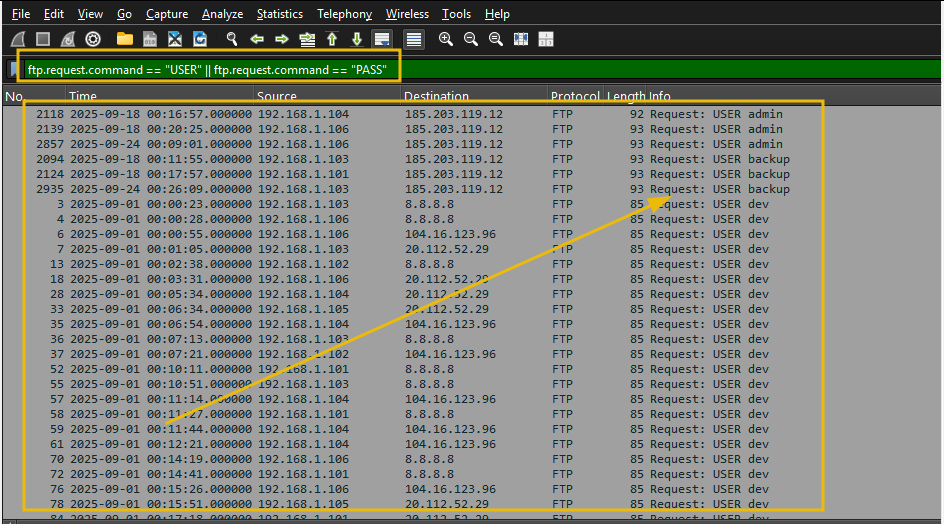
From the output, we can look for suspicious usernames or weak passwords.
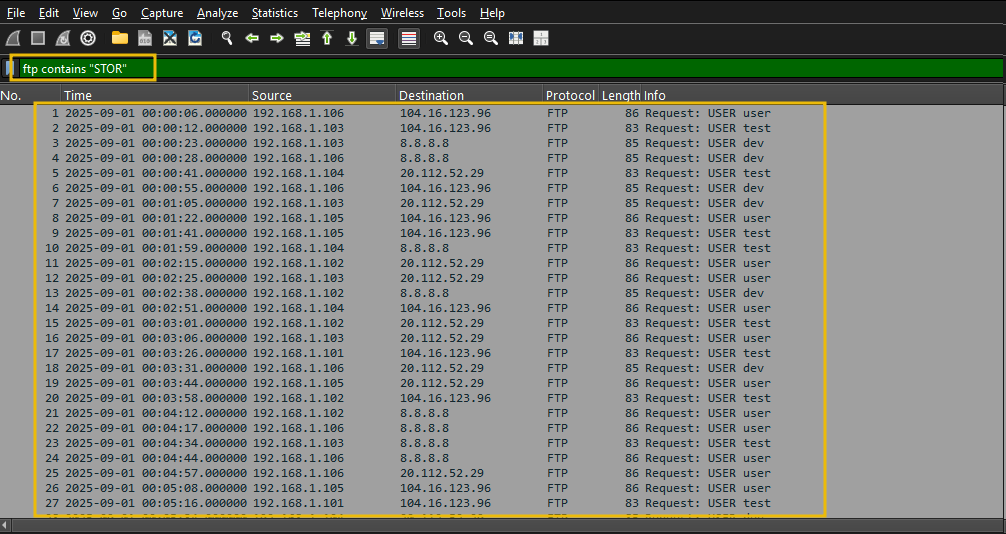
Look for Anomalies in Filenames or Credentials
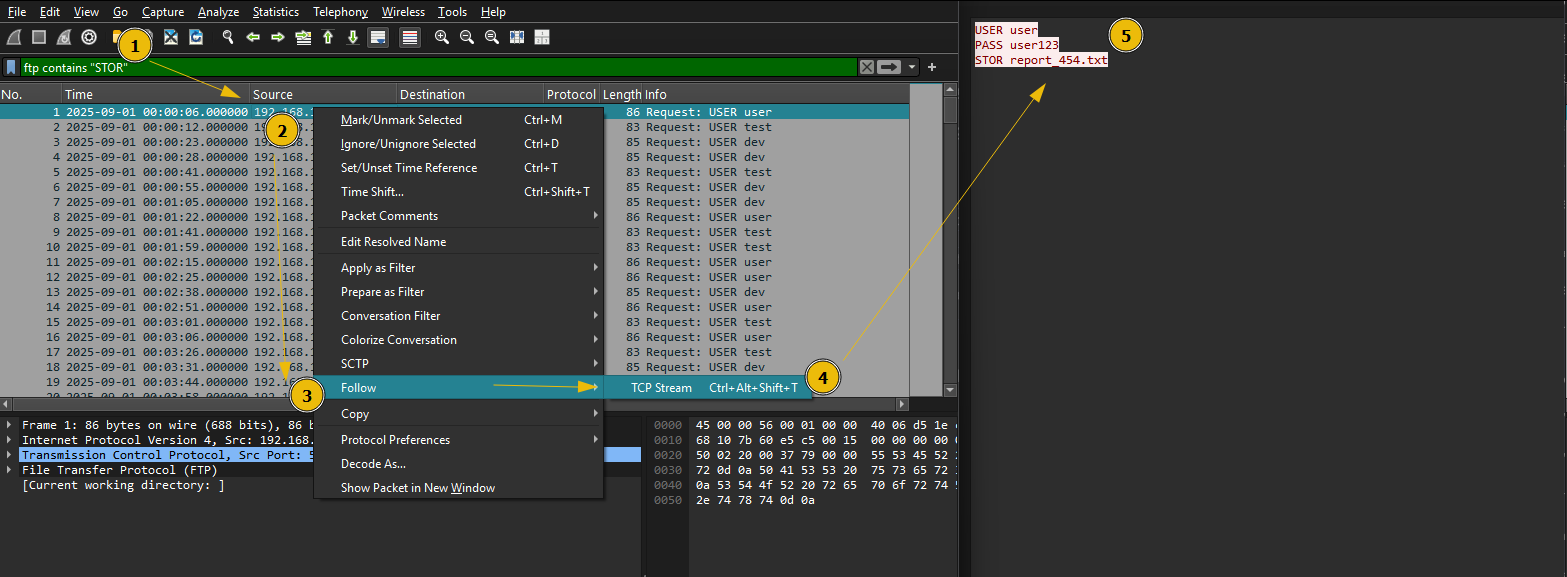
Filter: ftp contains "STOR"
Right-click a packet → Follow → TCP Stream, as shown below:
We can look at suspicious files by filtering on the file extensions like PDF, csv, TXT etc. Let's apply a filter on ftp packets containing the term csv in it, as shown below:
Filter: ftp contains "csv"
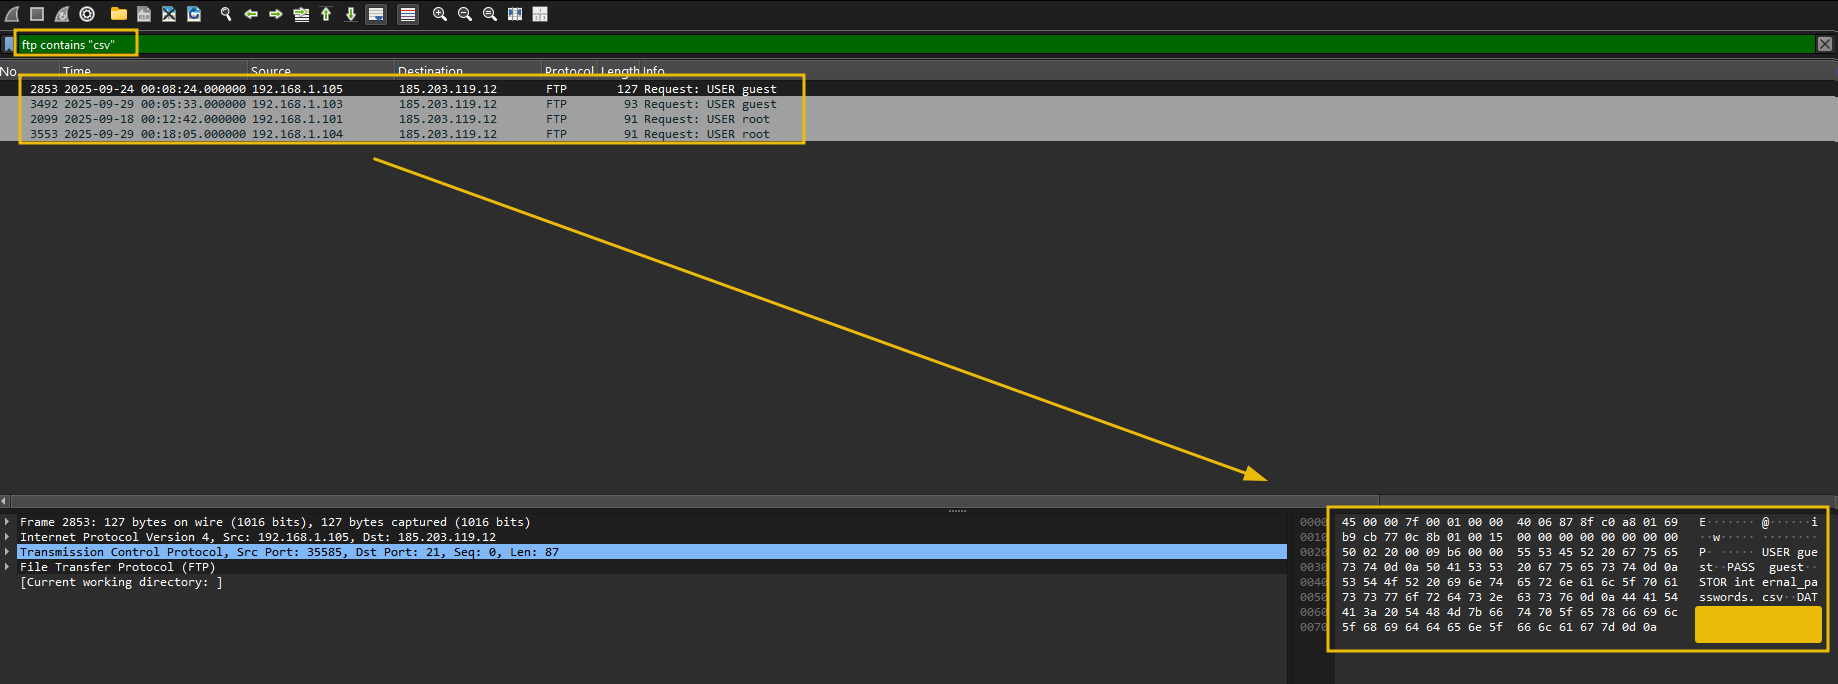
The above results show a suspicious IP connected as Guest account has transferred some sensitive csv files to a supicious external IP.
Look at the traffic with a large length, using the filter ftp && frame.len > 90 and check out the content in TCP Stream, as shown below:
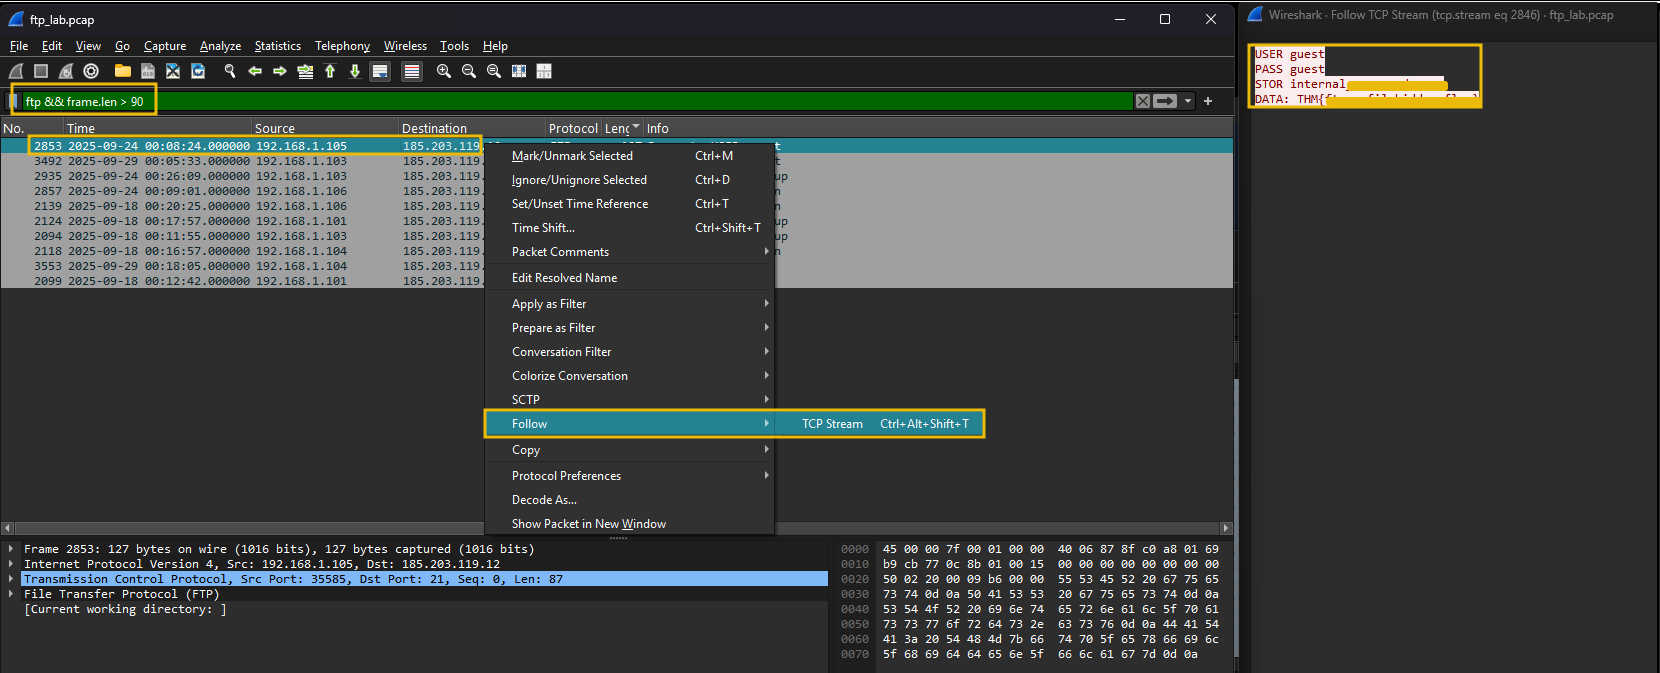
Looks like a document with sensitive information was being transferred to the external IP address. Explore other streams to find more indicators of sensitive documents being exfiltrated through the HTTP protocol.
How many connections were observed from the guest account? 5
Apply the filter; what is the name of the customer-related file exfiltrated from the root account? customer_data.xlsx

Which internal IP was found to be sending the largest payload to an external IP? 192.168.1.105

What is the flag hidden inside the ftp stream transferring the CSV file to the suspicious IP? THM{ftp_exfil_hidden_flag}
Data exfiltration via HTTP is when an attacker moves sensitive data out of a target network using HTTP as the transport. HTTP is commonly abused because it blends with normal web traffic, can traverse firewalls and proxies, and can be obfuscated (encoding, encryption, tunneling). This detection task aims to teach SOC analysts how to identify signs of HTTP-based exfiltration in packet captures (Wireshark) and logs (Splunk), and to provide practical search queries and investigation steps.
HTTP is very common; attackers hide exfiltration in the noise of legitimate web usage.
Successful detection stops data breaches and helps trace attacker activity post-compromise.
Organizations must detect and respond to protect sensitive data and meet compliance requirements.
POST uploads to external servers: Bulk data is sent to attacker-controlled hosts or cloud storage in POST request bodies.
GET requests with encoded data: Attacker squeezes small chunks into query strings or path segments (useful for low-and-slow exfiltration).
Use of common services / CDN: Exfiltration disguised as uploads to popular services or attacker-controlled subdomains under reputable domains.
Custom headers: Data placed in headers (e.g., X-Data: <base64>) may bypass some string-based DLP.
Chunked transfer / multipart: Large payloads split into multiple requests to avoid size thresholds.
HTTPS/TLS tunneling: The encrypted channel hides the payload; detection requires TLS inspection, SNI analysis, or metadata-based detection.
Staging via cloud services: The attacker uploads to Dropbox/GitHub/Gist and then fetches externally.
Adversaries adapt: low-and-slow approaches, encryption/encoding, and use of legitimate services to evade detection.
Unusually large HTTP POST requests to external/unexpected hosts.
HTTP requests to domains with low reputation / rarely seen in baseline traffic.
Frequent small requests (beaconing) to the same host, followed by large uploads.
Chunked or multipart transfers where multiple requests compose a larger file.
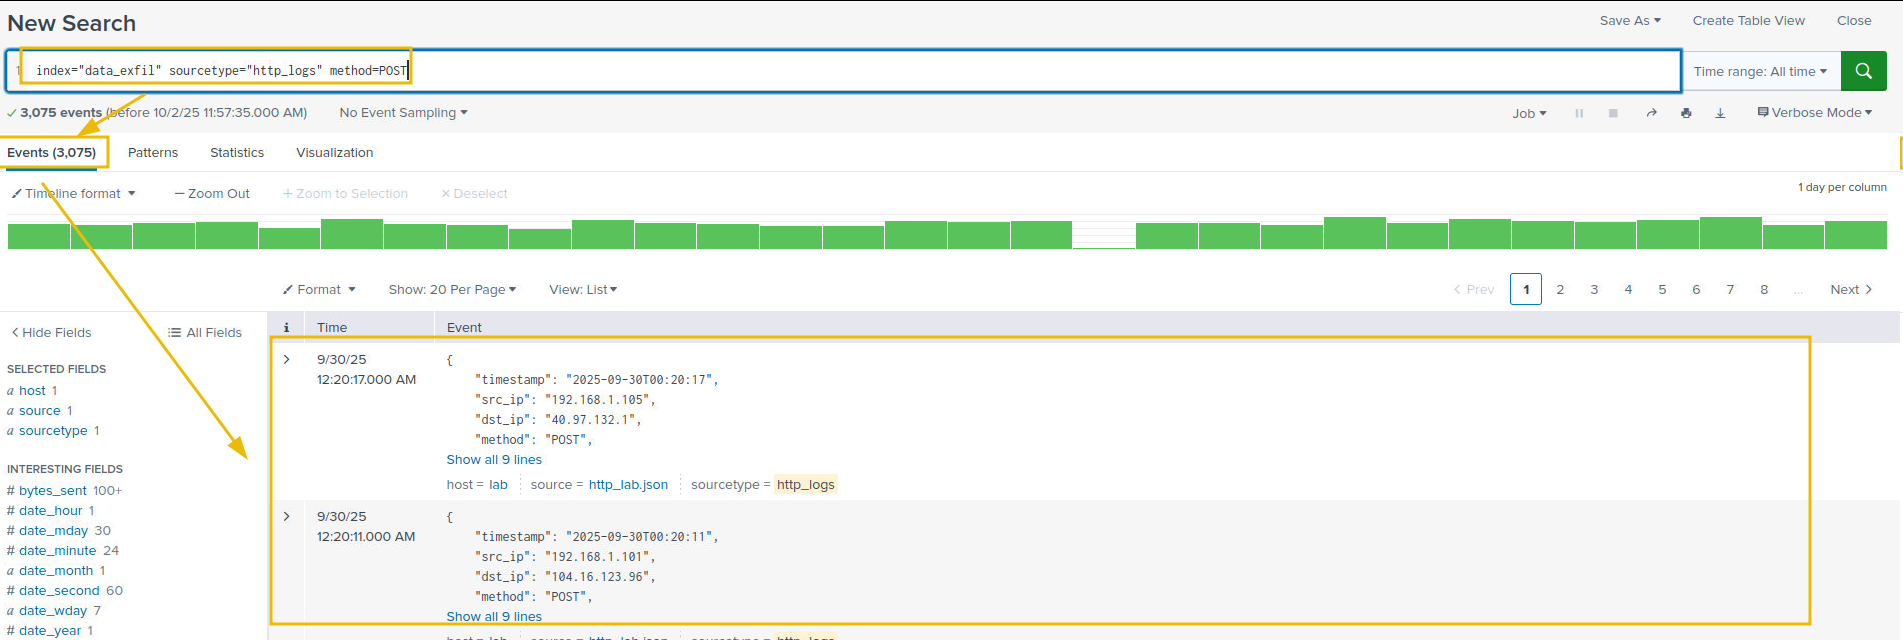
Let's examine the http logs in Splunk and see if we can find the indicators of the data exfiltration attempt in the logs.
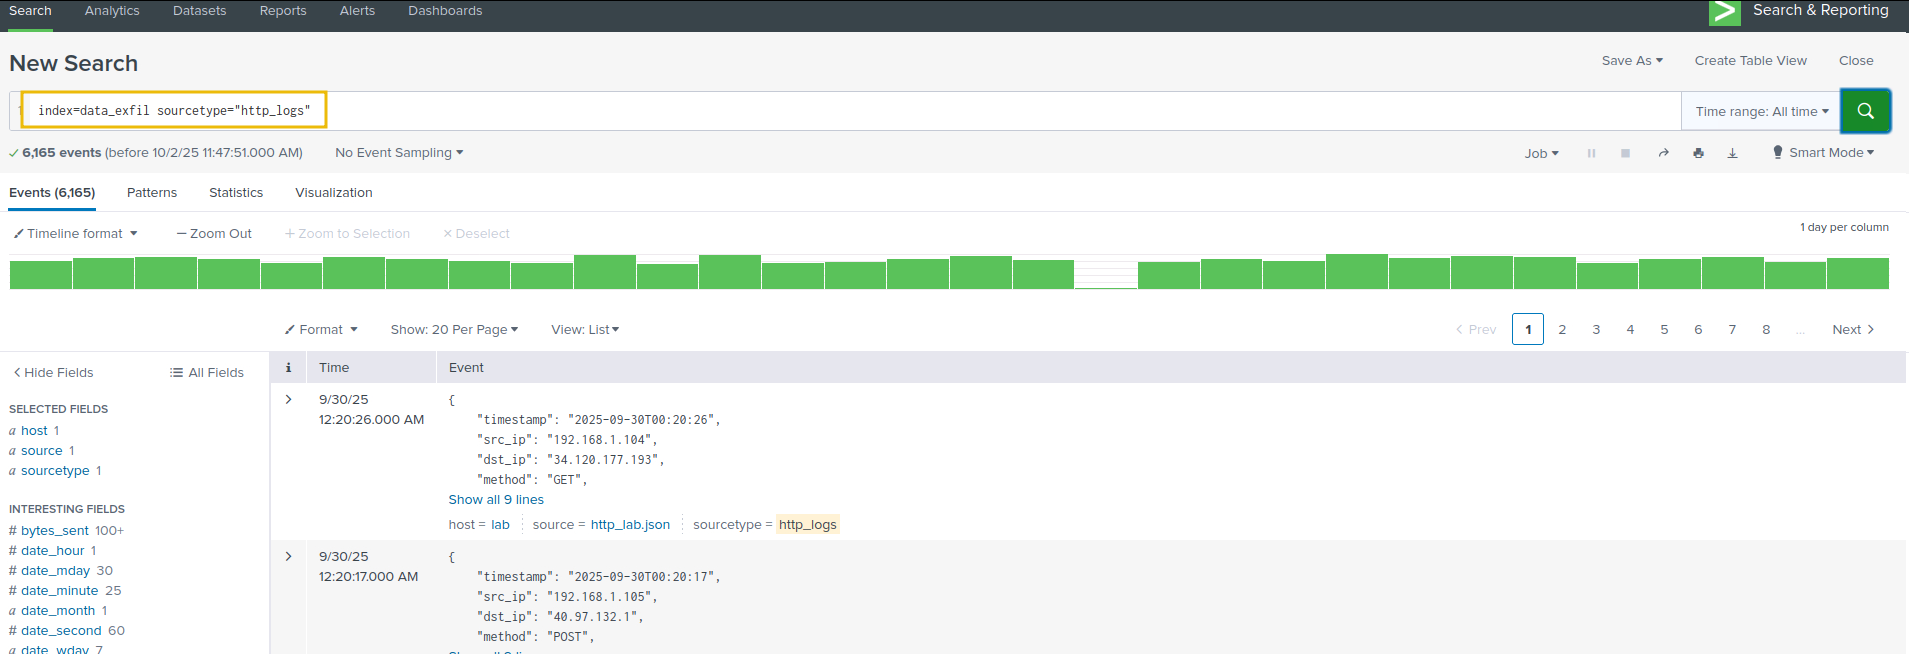
To start, use the following search query to get the http_logs and make sure to select Time range as All Time, as shown below:
Search Query: index="data_exfil" sourcetype="http_logs"
As we understand, the exfiltration attempts can be done via POST requests. We will apply a filter on the POST method to further narrow down our results, as shown below:
Search Query: index="data_exfil" sourcetype="http_logs" method=POST
Let's now look at the average amount of bytes sent out to various domains, as shown below:
Search Query: index="data_exfil" sourcetype="http_logs" method=POST | stats count avg(bytes_sent) max(bytes_sent) min(bytes_sent) by domain | sort - count
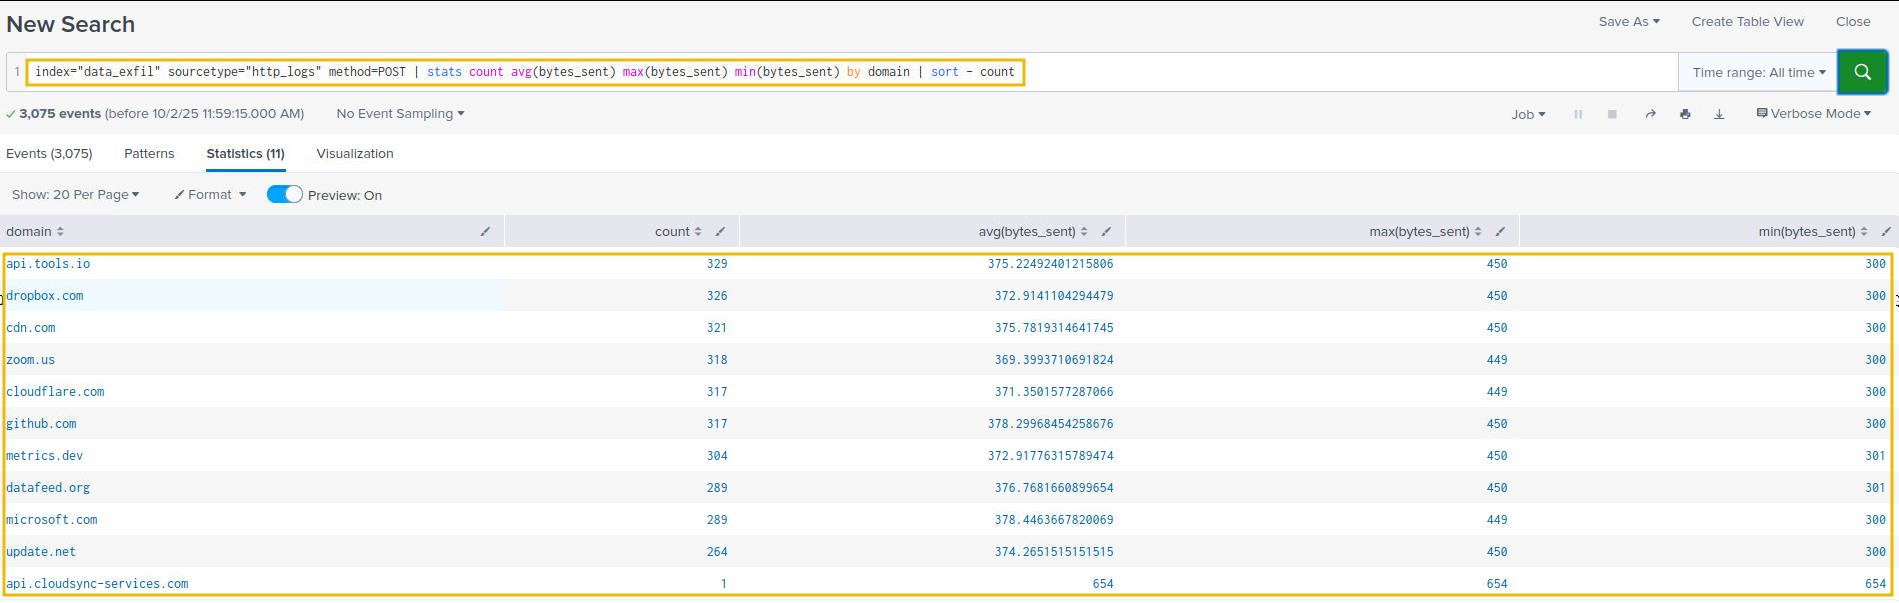
Let's filter out benign traffic and isolate POSTs with large payloads.
Search Query: index="data_exfil" sourcetype="http_logs" method=POST bytes_sent > 600 | table _time src_ip uri domain dst_ip bytes_sent | sort - bytes_sent
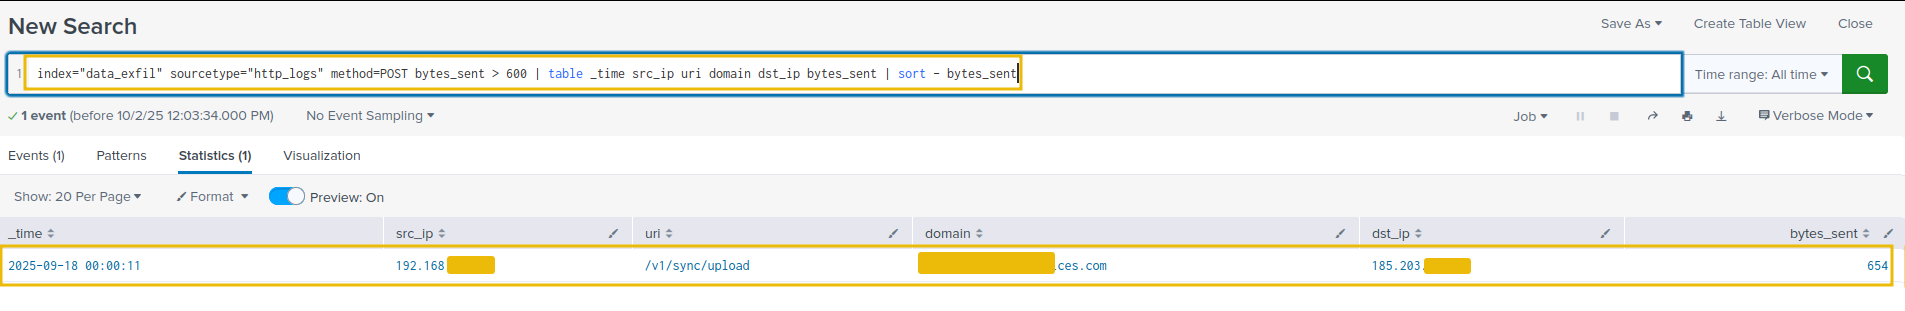
Our analysis so far points to one suspicious entry, with a large chunk of data uploaded to an external source. Let's correlate this with the pcap to extend our analysis further.
Open the http_lab.pcap placed in the /data_exfil/http_exfil/ folder.
Apply a filter on the HTTP traffic, as shown below:
Filter: http
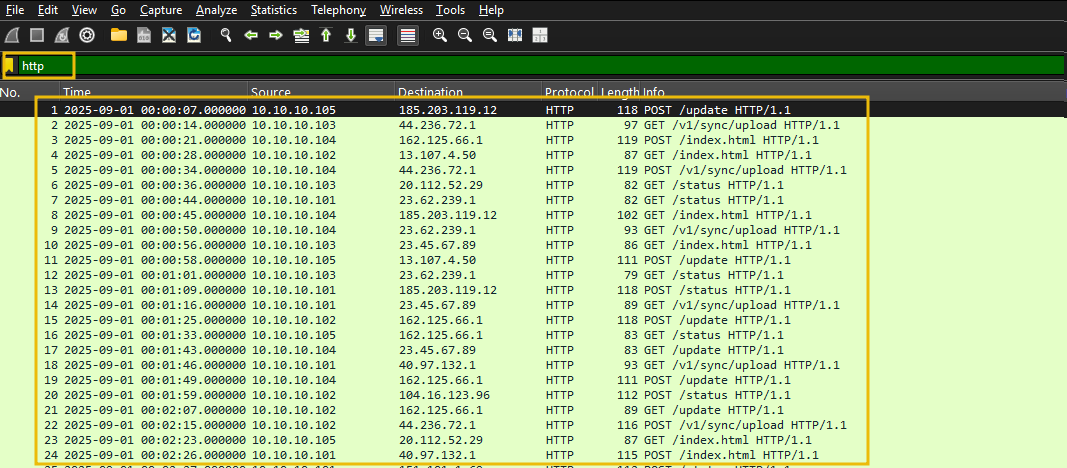
We can see HTTP traffic with both GET and POST requests. Filter on POST requests, as shown below:
Filter: http.request.method == "POST"
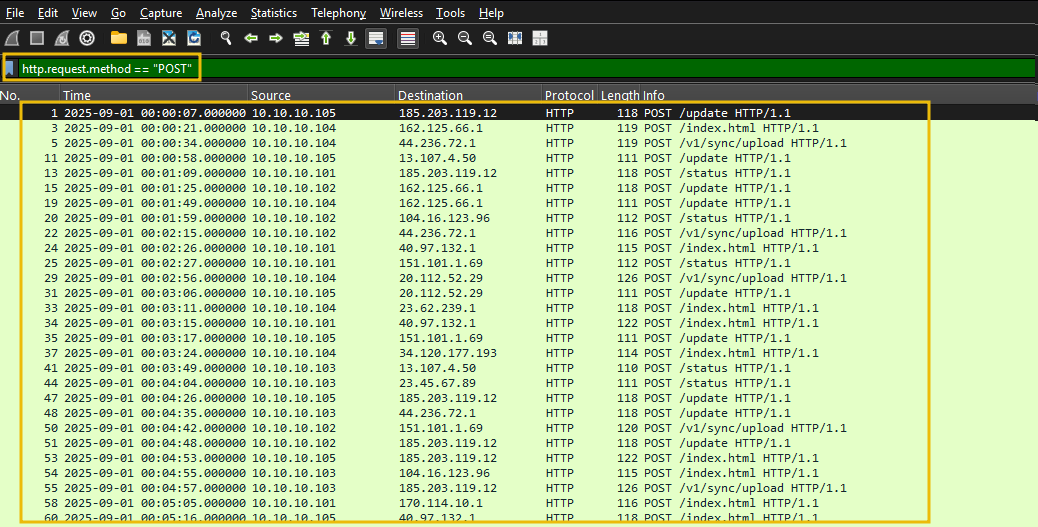
Filter on the traffic with the frame length of more than 500, as shown below:
Filter: http.request.method == "POST" and frame.len > 500
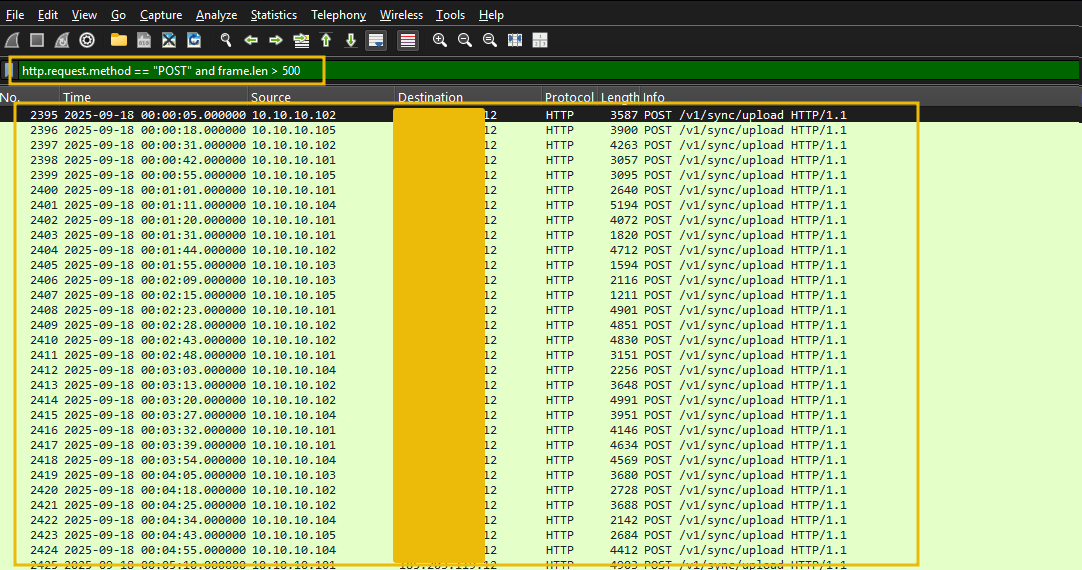
We still have a lot of noise. Let's increase the size to 750 and see if we can further filter down the result.
Filter: http.request.method == "POST" and frame.len > 750
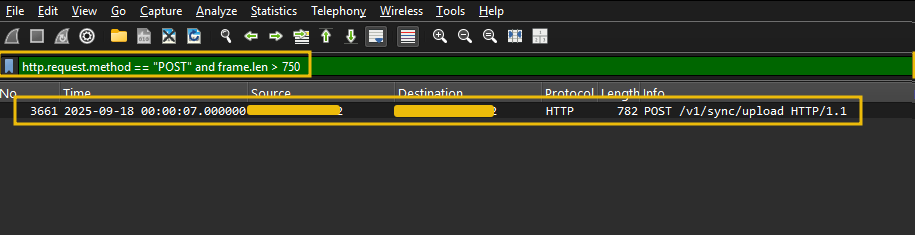
This request shows only one entry, which looks the same as the one we found in Splunk. Let's go to the HTTP stream to see the file's content, as shown below:
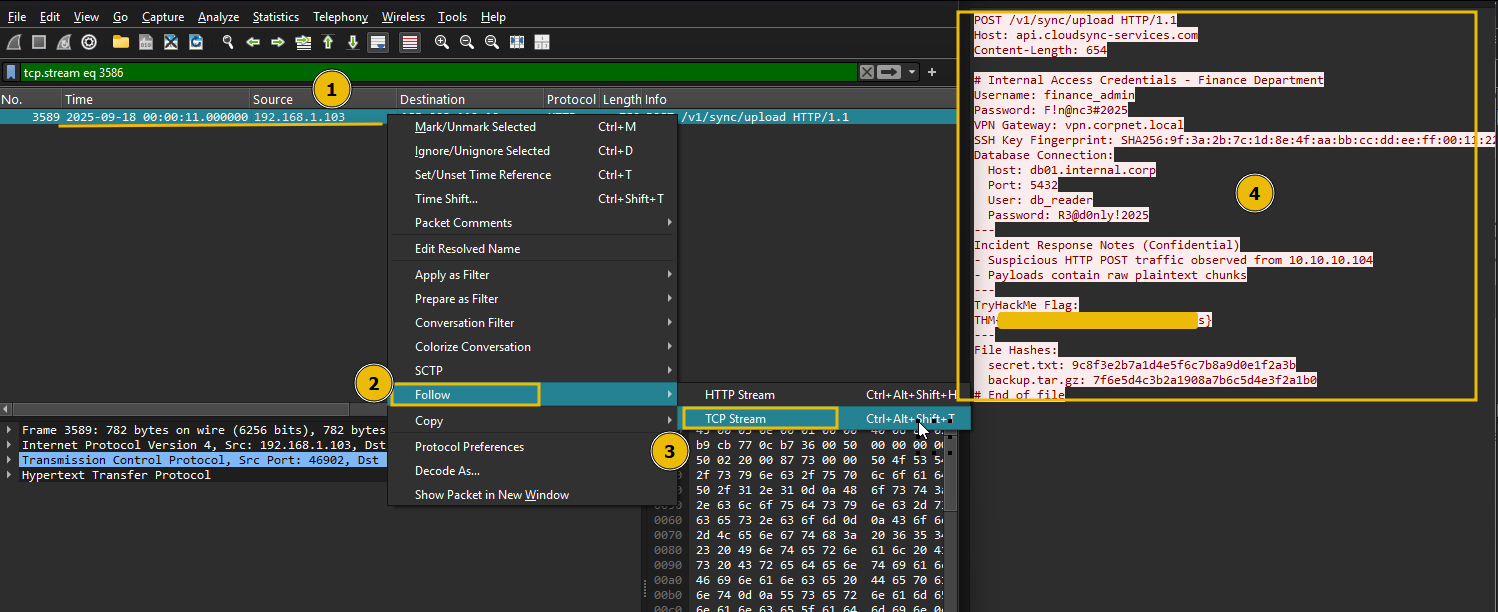
Great. We have looked at the indicators of data exfiltration attempts in the logs and network traffic and were able to correlate and identify the secret document being exfiltrated to the external IP.
Which internal compromised host was used to exfiltrate this sensitive data? 192.168.1.103

What's the flag hidden inside the exfiltrated data? THM{http_raw_3xf1ltr4t10n_succ3ss}

ICMP is a network-layer protocol used for diagnostics and control (e.g., ping, TTL exceeded). Because it is commonly allowed through firewalls and typically inspected less strictly than TCP/UDP, attackers sometimes abuse ICMP to tunnel and exfiltrate data. Malicious actors encode data into ICMP payloads (echo request/reply, timestamp, info) and send it to a remote listener under their control.
Common techniques:
ICMP echo (type 8) / reply (type 0) tunneling: attackers place encoded (base64, hex) chunks of files inside ICMP payloads. The remote server collects and decodes them.
Custom ICMP types/codes: using uncommon ICMP types or non-zero codes to avoid signature-based detections.
Fragmentation and reassembly: large payloads are split across multiple packets.
Encryption/obfuscation: Encrypting or encrypting payloads (base64 is common) to look like random data.
Indicators that something may be malicious:
Persistent ICMP sessions to an external host not used for legitimate monitoring.
Unusually large ICMP payloads or frequent ICMP with payload > typical ping size.
ICMP payloads that contain high-entropy data or patterns consistent with base64/hex.
Bursts of ICMP are immediately followed by no other legitimate application traffic from the same host.
Look for the following in a pcap when inspecting in Wireshark:
ICMP packet volumes: a single host sending many ICMP echo requests to an external IP.
Large frame.len or icmp.payload: pings with payloads much larger than typical (e.g., > 64 bytes).
ICMP type/code unusual values: e.g., unusual use of timestamp(13/14) or custom codes.
Regular timing (periodicity): evenly spaced ICMP packets carrying similar-sized payloads.
Fragments with reassembly: multiple ICMP fragments from the same src/dst pair.
Traffic Analysis
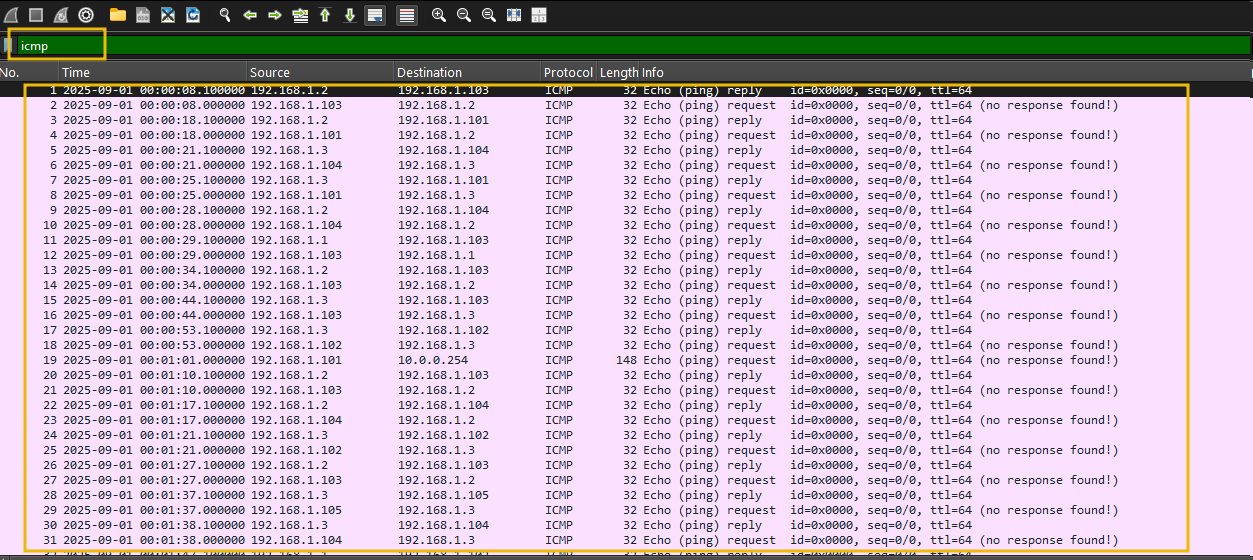
For this task, open the icmp_lab.pcap placed in /data_exfil/icmp/exfil folder on the Desktop.
Filter All ICMP Traffic
The filter below isolates all ICMP packets. Look for unusually frequent or large ICMP Echo Requests/Replies.
Filter: icmp
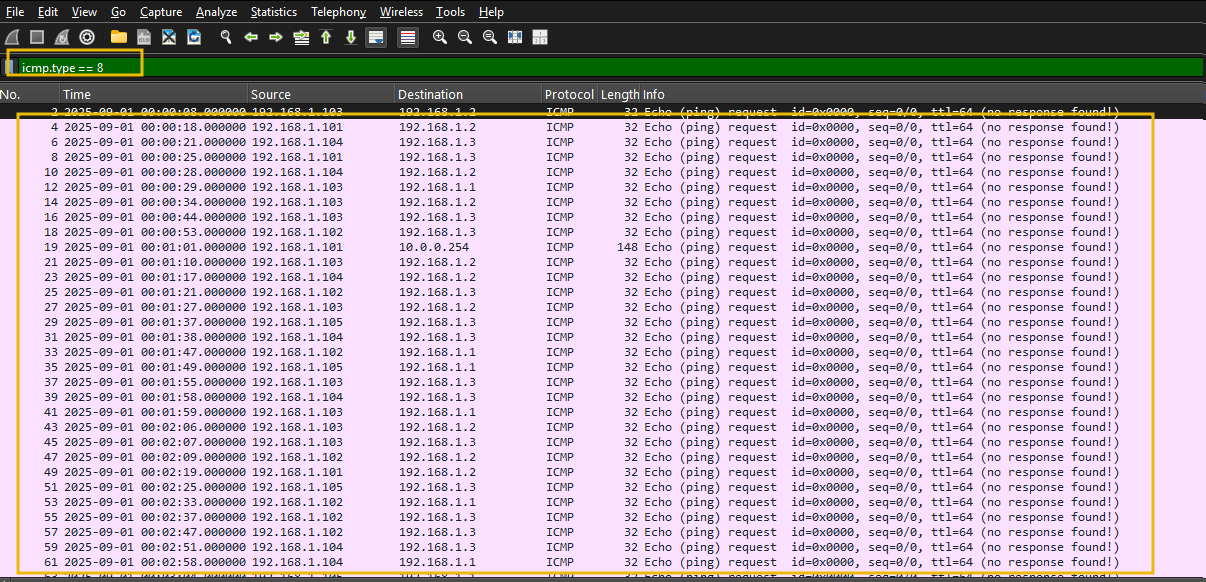
Isolate Echo Requests
Let's apply the filter to isolate ICMP Echo Request packets, as shown below:
Filter: icmp.type == 8
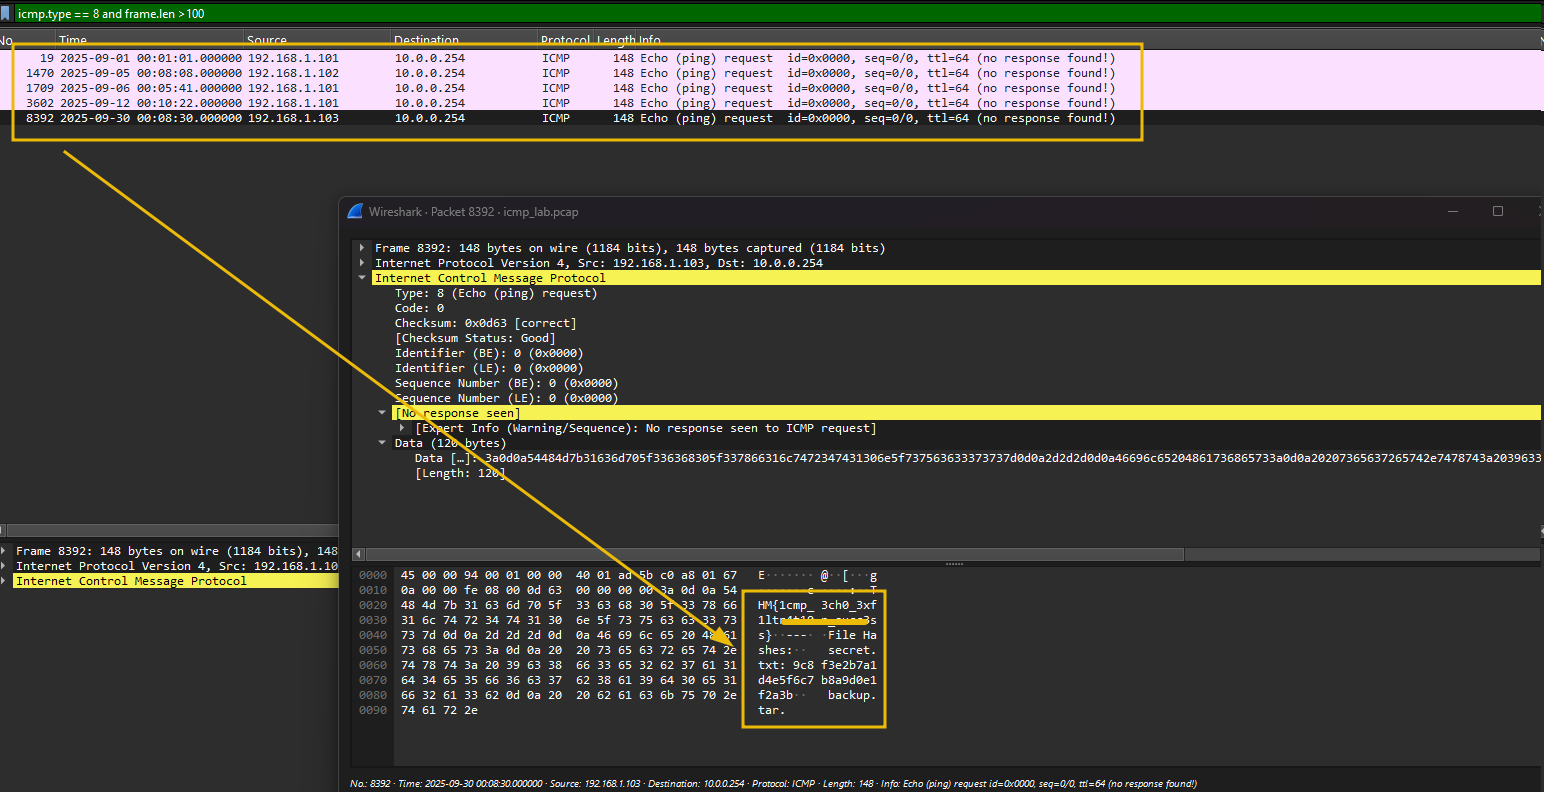
Examine Large ICMP Packets
Let's now apply the filter on the ICMP requests and focus on the frame length over 100, as shown below:
Filter: icmp.type == 8 and frame.len > 100
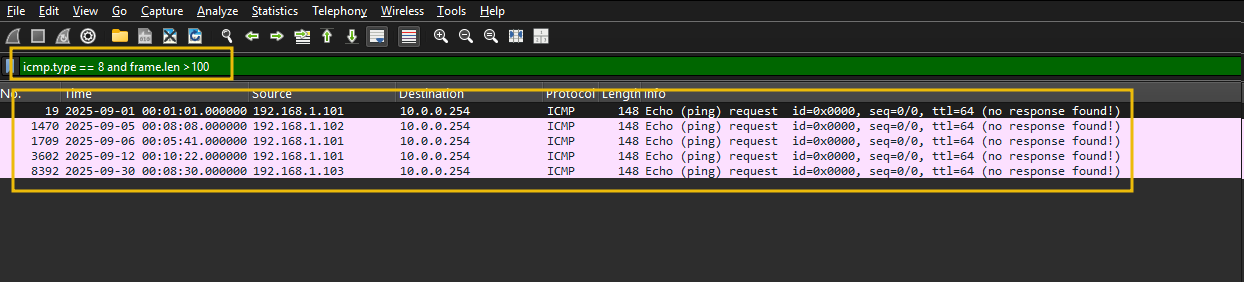
Flags packets with unusually large payloads. Normal pings are ~74 bytes total. Anything over 100 is suspicious.
That's it.
ICMP is simple, and any anomaly can be detected easily by examining the frame size and investigating the larger payload size than usual.
What is the flag found in the exfiltrated data through ICMP? THM{1cmp_3ch0_3xf1ltr4t10n_succ3ss}

That's it from this room. This room only touched a few channels used for data exfiltration, and we looked at the network-centric log sources to find the footprints of the data being sent out of the organization.
We've explored data exfiltration from a defender's perspective in this room. We covered:
The Fundamentals: What data exfiltration is and why it's a critical threat to organizations.
Attacker Frameworks: How data exfiltration fits into established models like the Cyber Kill Chain (Actions on Objectives).
Common Techniques: The various methods attackers use to steal data, including FTP, HTTP, DNS & ICMP tunneling.
Adversaries use more channels to exfiltrate the data, and we can look at other log sources to find indicators of the attack. Future rooms will cover more.
This room offered a practical look at how adversaries abuse commonly allowed protocols to move sensitive data undetected. Across DNS tunneling, FTP, HTTP, and ICMP, a pattern emerged: attackers lean on protocols that firewalls rarely block and that produce noise that blends with legitimate traffic. The detection playbook across all four techniques came down to the same fundamentals — look for anomalous volume, unusual payload sizes, suspicious destinations, and process or credential context that doesn't fit baseline behavior. From a real-world perspective, these same indicators translate directly to SOC triage: proxy logs for HTTP, DNS resolver logs for tunneling, flow data for FTP, and ICMP payload inspection at the network perimeter. The biggest takeaway is that correlation across log sources will always outperform any single-source detection rule.