AWS Security Logging (TryHackMe)

Search for a command to run...
No comments yet. Be the first to comment.
Link to the challenge on TryHackMe: Modern Web Stacks Introduction During a time-boxed engagement, the first tester to identify Apache/2.4.49 in a Server: header already knows the exact CVE before the
Link to the challenge/walkthrough on TryHackMe: Broken Authentication Introduction Authentication is the process by which a web application verifies the identity of the user making a request. It typic
Link to the HealthGPT AI security CTF challenge on TryHackMe. Meet HealthGPT, a well-meaning virtual assistant used by a busy healthcare team. It helps clinicians look up procedures, draft notes, and
Link to the section of the AI Odyssey CTF on TryHackMe: Token City. It covers challenges like: ML Sec: The Loan Arranger | AI Sec + DFIR: Rogue Commit | AI Sec + Web App Sec: Sealed Substation | Agent
Link to the Privilege Escalation Challenge on TryHackMe: Linux Privilege Escalation: Automation Introduction By now, you should have an understanding of basic privilege escalation techniques and how t
This write-up covers TryHackMe’s AWS Security Logging room, which focuses on monitoring AWS cloud environments using CloudTrail and GuardDuty. The challenge explores three key security areas: Control Plane monitoring, Managed Services, and Workload security. Through practical Splunk queries, we investigate a cryptocurrency mining incident on an EC2 instance, analyzing GuardDuty alerts, CloudTrail logs, and service-specific logs to piece together the attack timeline.
Amazon Web Services (AWS) is one of the most used IaaS cloud providers, and many companies worldwide, including TryHackMe, heavily use its compute, storage, databases, networking, and ML services. This room explains the tools to monitor the AWS cloud environment for threats and provides best practices on auditing AWS activities in SIEM by the SOC.
Tip: It is a good idea to create your own AWS account and test each service as you go through the tasks. While this room focuses on the SIEM perspective, seeing how things appear in the AWS console will help you better understand the material. AWS has a free tier that you can try by following the link. Just be mindful of the costs going beyond the free tier.
Explore control plane, managed services, and workload security
Practice using CloudTrail and GuardDuty for threat detection
Learn about cloud log sources, such as CloudFront and S3 logs
Gain a broad overview of how to log and monitor AWS as a SOC
Complete the Cloud Security Pitfalls room
Complete the Splunk: The Basics room
Preferably, complete the Introduction to AWS module
Preferably, complete the SOC Level 1 Analyst path
Before explaining what can be logged in AWS, let's recall what exactly we want to protect. To make it easier, imagine the simplest infrastructure built in AWS: a website hosted on a virtual machine (Amazon EC2) that uses an AWS-managed SQL database (Amazon RDS) and a managed file storage (Amazon S3). To monitor it properly in a SOC, you need to cover at least three security areas:
Control Plane: Monitor the actions of those who access the AWS console and manage the infrastructure
Workloads: Monitor files and processes on the website's VM, same as you would do in on-premises
Managed Services: Monitor access to the RDS database and suspicious changes to the S3 file storage

AWS, and cloud environments in general, can grow large and overly complex (example). As your company grows, you will find it increasingly challenging to distinguish malicious activity from legitimate behavior and to maintain full visibility across all three security areas. A helpful tip in advance: be prepared to keep learning and adapting as you face challenges like those below.
Control Plane Chaos Some IT teams manage AWS resources via a graphical interface while others use automation tools, such as Terraform. You must know how your IT operates to build strong detection rules and reliably differentiate good and bad.
Containerized Workload Instead of regular virtual machines, your IT can run its applications in managed containers (Amazon Fargate) or use other serverless technologies. In this case, you must learn how the new technology works in order to monitor it.
Too Many Managed Services AWS has more than 200 managed services, many of which can be exploited in cyber attacks. The service selection by your company defines which logs SOC must ingest and which detection rules you must prepare.
Which security area covers management actions within the AWS console? Control Plane
Which of the mentioned AWS services provides virtual machines in the cloud? Amazon EC2
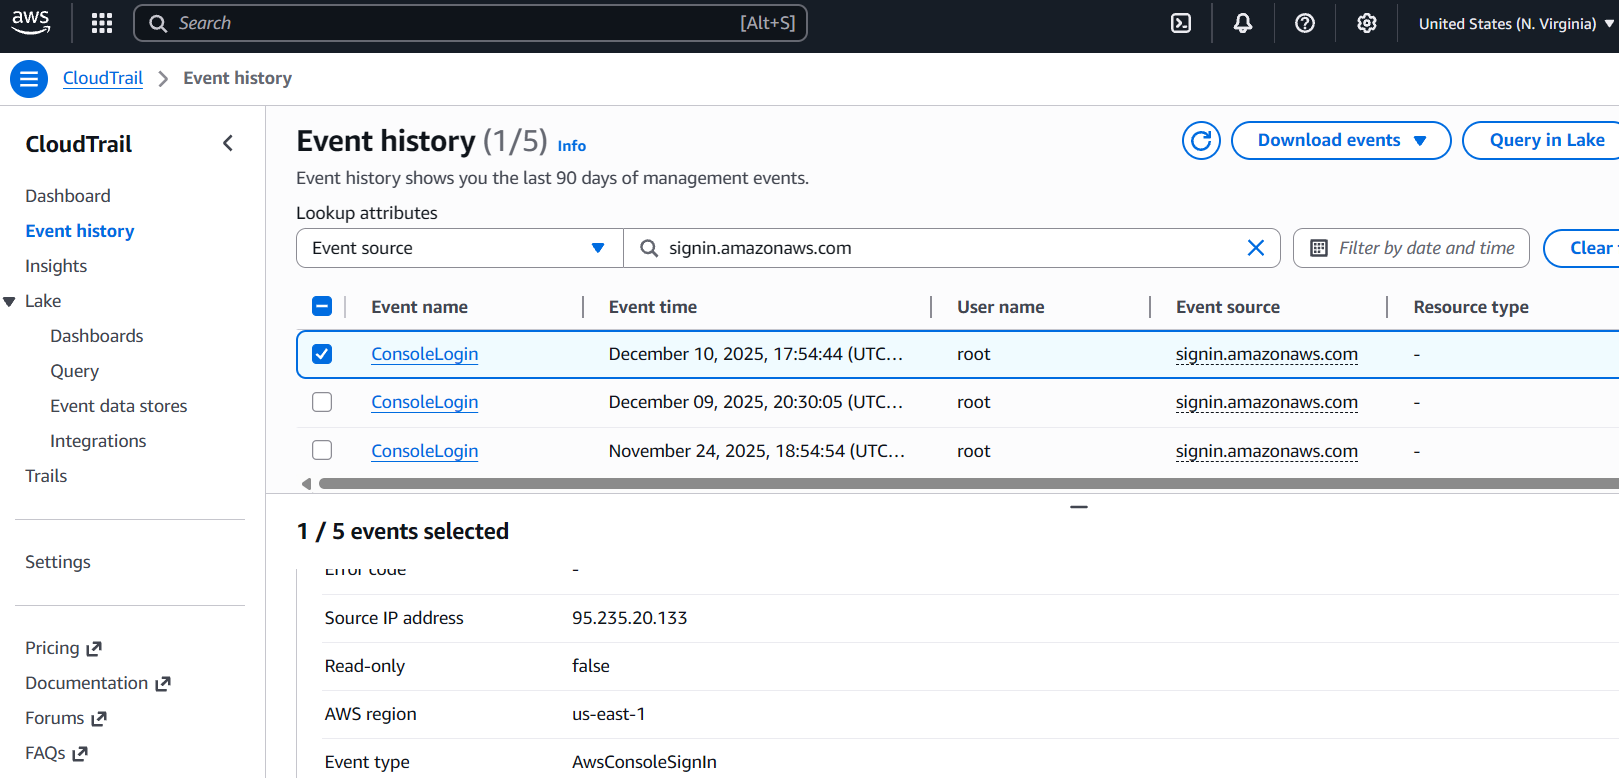
CloudTrail is the first AWS service that any SOC analyst must know. This service records all control plane activities, including console logins, launch of EC2 instances, access to S3 buckets, changes in user privileges and network settings, and more. Technically, CloudTrail is a service that logs all API calls you or your browser makes to the AWS servers. You can view CloudTrail logs in the CloudTrail > Event history menu:
CloudTrail events are enabled by default and are available for free for the past 90 days. However, if you want to keep logs longer (and you should), the common choice is to forward the logs to the S3 bucket, and then configure your SIEM to periodically pull the logs from that S3 bucket. The configuration process is a bit tedious, so it's better to refer to the Splunk documentation or other SIEM-specific guides.
| AWS Side: Send CloudTrail Logs to S3 Bucket | Splunk Side: Get CloudTrail Logs From S3 Bucket |
The sample CloudTrail logs are ingested into the Splunk aws index, so you can inspect the log structure there. You will learn the details in later rooms, but for now, just focus on the example and key fields below. As a reminder, in AWS terminology, an account and a user are not the same thing: an account represents an entire cloud tenant, while a user is an individual identity within that account. For example, you might have a john.doe user inside the 398985017225 AWS account.
// CloudTrail ConsoleLogin event about user authentication (simplified)
{
  "eventID": "b12da7f9-36a9-4ac1-9cb6-7d3b4874d2a7",
  "eventTime": "2025-12-10T17:54:44Z",
  "eventSource": "signin.amazonaws.com",
  "eventName": "ConsoleLogin",
  "awsRegion": "us-east-1",
  "sourceIPAddress": "72.44.21.87",
  "userAgent": "Mozilla/5.0 [...]",
  "requestParameters": null,
  "responseElements": {
    "ConsoleLogin": "Success"
  },
  "readOnly": false,
  "recipientAccountId": "398985017225",
   "userIdentity": {
    "type": "IAMUser",
    "arn": "arn:aws:iam::398985017225:user/john.doe",
    "accountId": "398985017225",
    "userName": "john.doe"
  },
}
eventSource: AWS service that was requested. Similar to Windows event channels (e.g. Security)
eventName: The name of the API call, such as ConsoleLogin, RunInstances, or CreateBucket
recipientAccountId: The target AWS account of the API call. That's where the activity happened
sourceIPAddress: Source of the API call. Useful to identify actions from an unusual location or known bad IPs
requestParameters: Event-specific details. For CreateBucket, it will contain the name of the created S3 bucket
userIdentity.*: Details about the actor behind the API call. ARN subfield is a globally unique user identifier
readOnly: Whether the API call is a read (e.g. GetObject) or non-read (e.g. PutObject, ConsoleLogin) request
Practice
For this task, open the Splunk console in your web browser.
You can start from the index=aws eventName=ConsoleLogin Splunk query.
Search for All Time and note that field ordering may vary from the example.
From which IP did jeff.harrison user log in to AWS?
index=* user_name="jeff.harrison" source="s3.json"

To which AWS account ID did jeff.harrison user log in?
index=* user_name="jeff.harrison" source="s3.json"

What S3 bucket did jeff.harrison create after the login?
Note: You will need to change your Splunk query.
index=* user_name="jeff.harrison" source="s3.json"

Once CloudTrail is in your SIEM, you can start using it for control plane monitoring. This is essential because your IT team may accidentally expose internal resources, grant excessive permissions, or fall victim to a cyber attack. CloudTrail gives you the visibility needed to detect all these incidents by recording every API call. For example, imagine SSH access to your Linux VM suddenly becomes public, and you need to know who changed the firewall rules. Simply search CloudTrail for ModifySecurityGroupRules events and review the matching record. Here is how it appears in SIEM logs:
// Insecure security group modification (simplified)
{
  "eventTime": "2025-12-12T15:19:57Z",
  "eventSource": "ec2.amazonaws.com",
  "eventName": "ModifySecurityGroupRules",                    // Change in AWS security group (VM firewall)
  "awsRegion": "us-east-1",
  "sourceIPAddress": "34.77.14.56",
  "userAgent": "Mozilla/5.0 [...]",
  "requestParameters": {
    "ModifySecurityGroupRulesRequest": {
      "SecurityGroupRule": {
        "SecurityGroupRuleId": "sgr-0134d56a1ff2c9c74",
        "SecurityGroupRule": {                                // The actual change to the security group
          "CidrIpv4": "0.0.0.0/0",                            // Alows access from anywhere on the Internet
          "FromPort": 22,                                     // To ports in range 22-22 (just one SSH port)
          "ToPort": 22,
          "IpProtocol": "tcp"
        }
      },
      "GroupId": "sg-023caa3bf78723abe"                       // The security group can be used by many VMs
    }
  },
  "responseElements": {...},
  "readOnly": false,                                          // Indicates a "write", risky API call
  "recipientAccountId": "398985017225",
  "userIdentity": {
    "type": "IAMUser",
    "arn": "arn:aws:iam::398985017225:user/jeff.harrison",
    "accountId": "398985017225",
    "userName": "jeff.harrison"                               // Now you know who exposed the SSH port
  },
}
There are hundreds of control plane detections you can build using CloudTrail logs. For production-ready examples, review the Sigma rules and search for "AWS" in the Elastic rule repository for additional inspiration. When writing custom detections or threat hunting, don't hesitate to Google or ask an LLM which event to look for - AWS has thousands of API actions, and no one memorizes them all. To get started, focus on the key areas below:
Start from the write events (readOnly=false), as they often indicate a high-risk change
IAM: Look for changes in user privileges, IAM access keys, and unusual AWS logins
EC2: Alert on insecure changes to the EC2 security groups, such as exposed RDP
S3: Alert whenever S3 buckets are made public, as they are often exposed by mistake
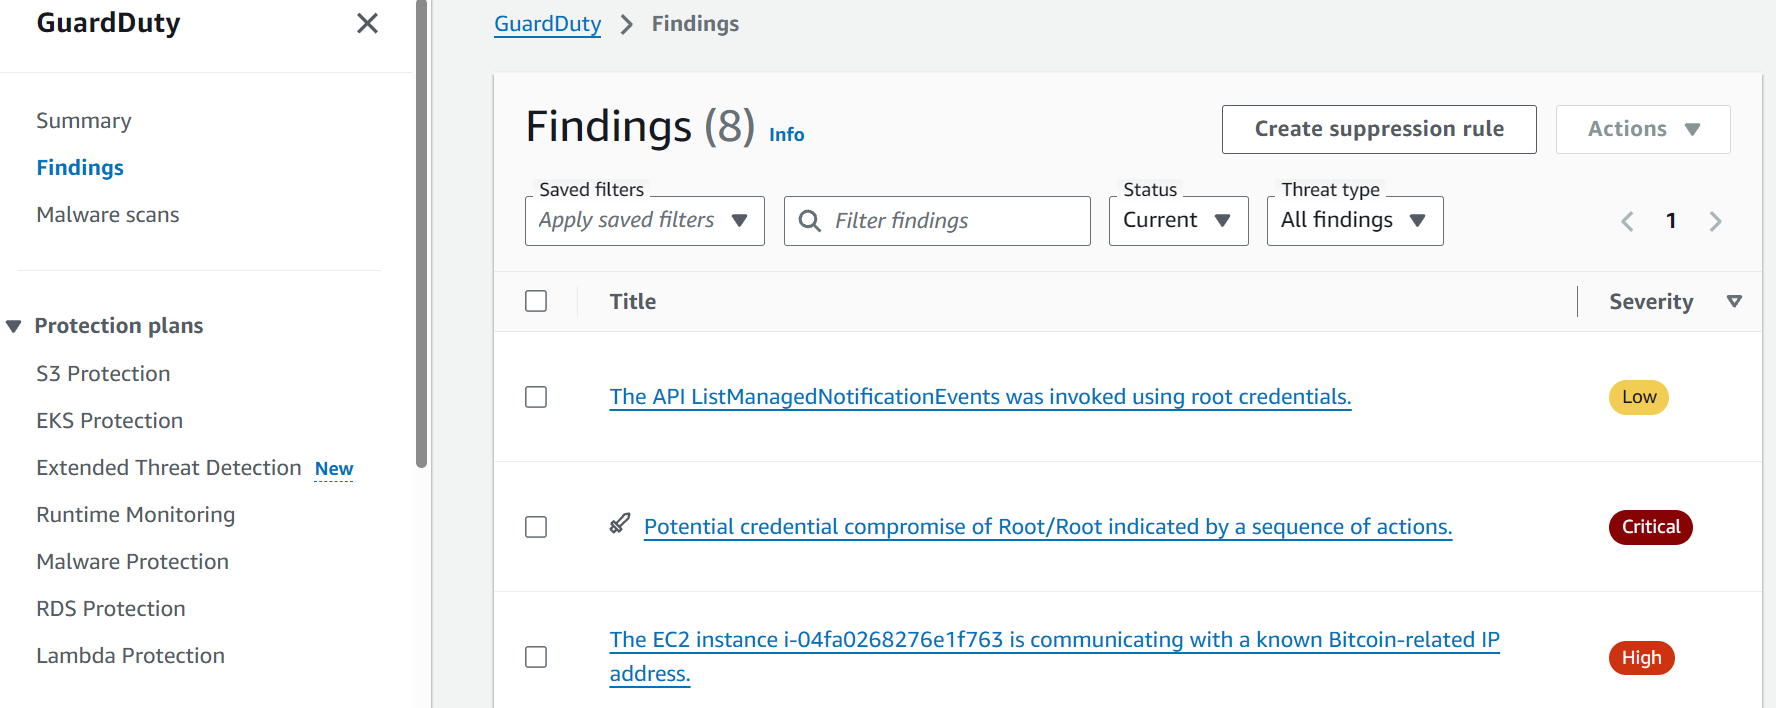
GuardDuty is an AWS service that automatically analyzes control plane, network, DNS, and endpoint activities within AWS and generates alerts on suspicious behavior in real time. It is a paid service, but you can have a 30-day trial, simulate an attack, and see the alerts in GuardDuty > Findings tab. GuardDuty is a perfect choice for companies without a SOC, because it is ready to use out of the box and has many built-in detection rules (finding types) covering the most common AWS threats, such as:
| GuardDuty Finding Type | Description |
| Exfiltration:IAMUser/AnomalousBehavior | The user performed suspicious control plane actions, often seen during data exfiltration |
| Policy:S3/BucketAnonymousAccessGranted | The S3 bucket was configured to allow public, anonymous access from the Internet |
| UnauthorizedAccess:EC2/RDPBruteForce | The EC2 instance is exposed to the Internet and is a target of the RDP brute force |
| Impact:EC2/BitcoinDomainRequest.Reputation | The EC2 instance queried a known domain related to cryptocurrency mining |
// The third GuardDuty alert from the screenshot (simplified)
{
  "AccountId": "398985017225",
  "CreatedAt": "2025-12-12T16:57:03.190Z",
  "Id": "c4cd89bf4deb284b5d317d22180ac495",
  "Resource": {                                 // Affected resource details, if any
      "InstanceDetails": {
      "ImageId": "ami-0ecb62995f68bb549",
      "InstanceId": "i-04fa0268276e1f763",
      "InstanceType": "t3.micro",
      "LaunchTime": "2025-12-12T15:17:18.000Z",
      "NetworkInterfaces": [...],
      "Tags": [...]
    },
    "ResourceType": "Instance"
  },
  "Service": {                                  // Finding-specific alert details
  "Action": {
      "ActionType": "NETWORK_CONNECTION",
      "NetworkConnectionAction": {
        "RemoteIpDetails": { "IpAddressV4": "45.32.185.122" },
        "RemotePortDetails": { "Port": 3333 }
      }
    },
    "FeatureName": "VpcFlowLogs",               // Log source used to detect the threat
    "ResourceRole": "TARGET",
    "ServiceName": "guardduty"
  },
  "Severity": 8,                                // Alert severity ranging from 1 to 10
  "Title": "The EC2 instance is [...]",         // The title you saw on the screenshot
  "Type": "CryptoCurrency:EC2/BitcoinTool.B",   // Detection rule (finding type) ID
  "UpdatedAt": "2025-12-12T16:57:03.190Z"
}
GuardDuty is likely the best monitoring service for companies without a strong security team, as it is very easy to use, can detect a large number of common threats, and does not require much knowledge to be effectively used by IT. However, any mature SOC team would still need to collect and monitor raw logs, such as CloudTrail, because:
GuardDuty alerts often lack sufficient context to fully scope and document the attack
GuardDuty detection rules do not adapt to your company-specific policies and risks
GuardDuty is effective against common threats, but is unlikely to detect advanced attacks
Finally, GuardDuty can't reliably detect when AWS logging is tampered with or disabled
Practice
Сontinue with the aws index in Splunk. You might need two queries:
index=aws sourcetype=aws:cloudtrail index=aws sourcetype=aws:cloudwatch:guarddutyFind the "AnomalousBehavior" GuardDuty alert in the logs.
From which VPN did the suspicious activity originate?
index=aws sourcetype=aws:cloudwatch:guardduty


Analyze two other alerts from the i-04fa0268276e1f763 EC2 instance.
What is the path to the detected malware, and which domain did it query?
index=aws i-04fa0268276e1f763 sourcetype=aws:cloudwatch:guardduty

index=aws i-04fa0268276e1f763 sourcetype=aws:cloudwatch:guardduty xmrig

Continue to the CloudTrail logs to get more instance context.
Who created the infected EC2 instance? Provide the full ARN field.
index=aws sourcetype=aws:cloudtrail i-04fa0268276e1f763
the role = root

Which two risky ports did that user expose for the EC2 instance?
Answer Example: 80, 443
For this step, we’ll need to add the eventName=ModifySecurityGroupRules to access the ports
index=aws sourcetype=aws:cloudtrail eventName="ModifySecurityGroupRules"

index=aws sourcetype=aws:cloudtrail eventName="ModifySecurityGroupRules"

CloudTrail is ideal for capturing control plane operations, but it doesn't provide visibility into service-specific actions. For example, it cannot see queries made to an Amazon RDS database, network traffic flowing through your VPCs, web requests served through Amazon CloudFront, and many other operations. To cover this blind spot, AWS provides detailed logging capabilities for each major service separately. Let's learn some examples!
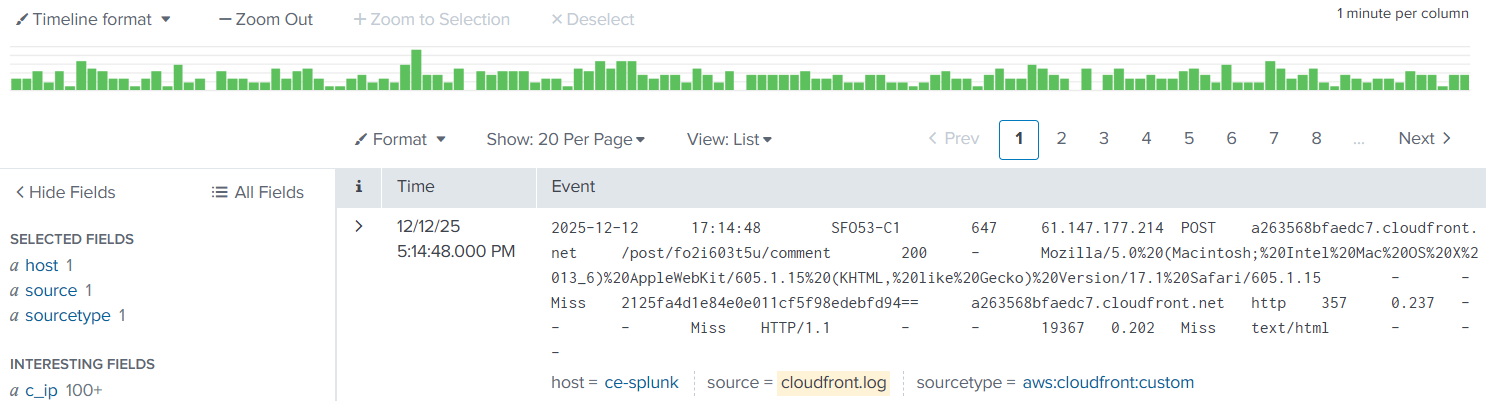
CloudFront is a CDN service heavily used by AWS customers to optimize and secure web applications. You might have heard about its competitors: Cloudflare, Fastly, and Akamai. The importance of this service is that it usually routes all web traffic and thus can capture SQL injections, CVE exploits, web shell uploads, brute force, and DDoS attacks. The log format is very similar to IIS access logs and follows the W3C standard, where c/cs prefix refers to client fields, and s/sc denotes server-side fields:
CloudFront Logs in Raw Format
date       time     edge_srv sc_bytes c_ip         cs_method cs_host       cs_uri_stem sc_status cs_user_agent
2025-12-12 11:32:11 SFO53-C1 4955     80.42.89.4   POST      tryhackme.com /login      200       Mozilla/5.0   [...]
2025-12-12 11:32:24 SFO53-C1 6002     88.15.14.16  GET       tryhackme.com /portal     200       Mozilla/5.0   [...]
2025-12-12 11:32:35 SFO53-C1 1624     13.13.17.146 GET       tryhackme.com /search     200       Mozilla/5.0   [...]
In the on-premises world, you would collect network logs from your firewall devices. But how would you monitor traffic in the cloud? AWS offers several services for auditing network traffic, with Amazon VPC Flow being the most notable one. This service records network flows to, from, and between your cloud workloads, giving you visibility into how systems communicate across your subnets. You will find many fields there, most importantly:
srcaddr and dstaddr: Source and destination IP address of the flow
srcport and dstport: Source and destination network port of the flow
protocol: IANA protocol number of the traffic (TCP is 6, UDP is 17, ICMP is 1)
action: Whether the traffic was allowed by AWS security groups and ACLs
account-id, vpc-id, interface-id: Additional context about the traffic source
VPC Flow Logs in Raw Format
version account-id interface-id srcaddr       dstaddr      srcport dstport protocol action [...]
2       123456789  eni-12345678 172.31.16.4   172.31.16.7  20641   80      6        ACCEPT [...]
2       123456789  eni-12345678 172.31.9.69   172.31.9.12  49761   22      6        REJECT [...]
Note that while VPC Flow Logs are very popular among SOC teams, they can be challenging to use and generate terabytes of events per day in busy environments. For example, VPC Flow Logs will generate a dozen events for just a single web request, because it logs every hop of the packet, both in and out, as separate events. Before you start ingesting it for network monitoring, consider alternatives with better noise-to-signal ratio: DNS logs from Amazon Route53 or endpoint events (e.g., Sysmon event codes 3 and 22)
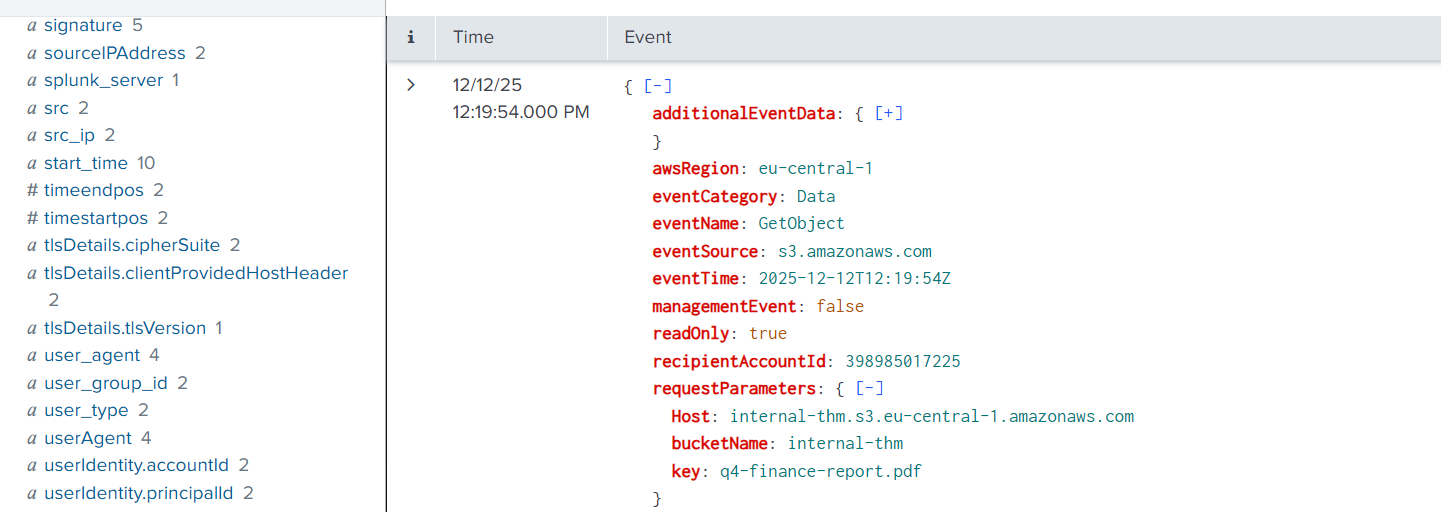
Remember that CloudTrail audits control plane activities and doesn't log operations inside managed services. However, CloudTrail can be extended to record Data events (CloudTrail > Your Trail > Data Events) for some of the services, including S3. With Data events, you will see operations on individual S3 objects, such as file access (GetObject) or upload to the bucket (PutObject). The log format is nearly identical to the CloudTrail control plane events:
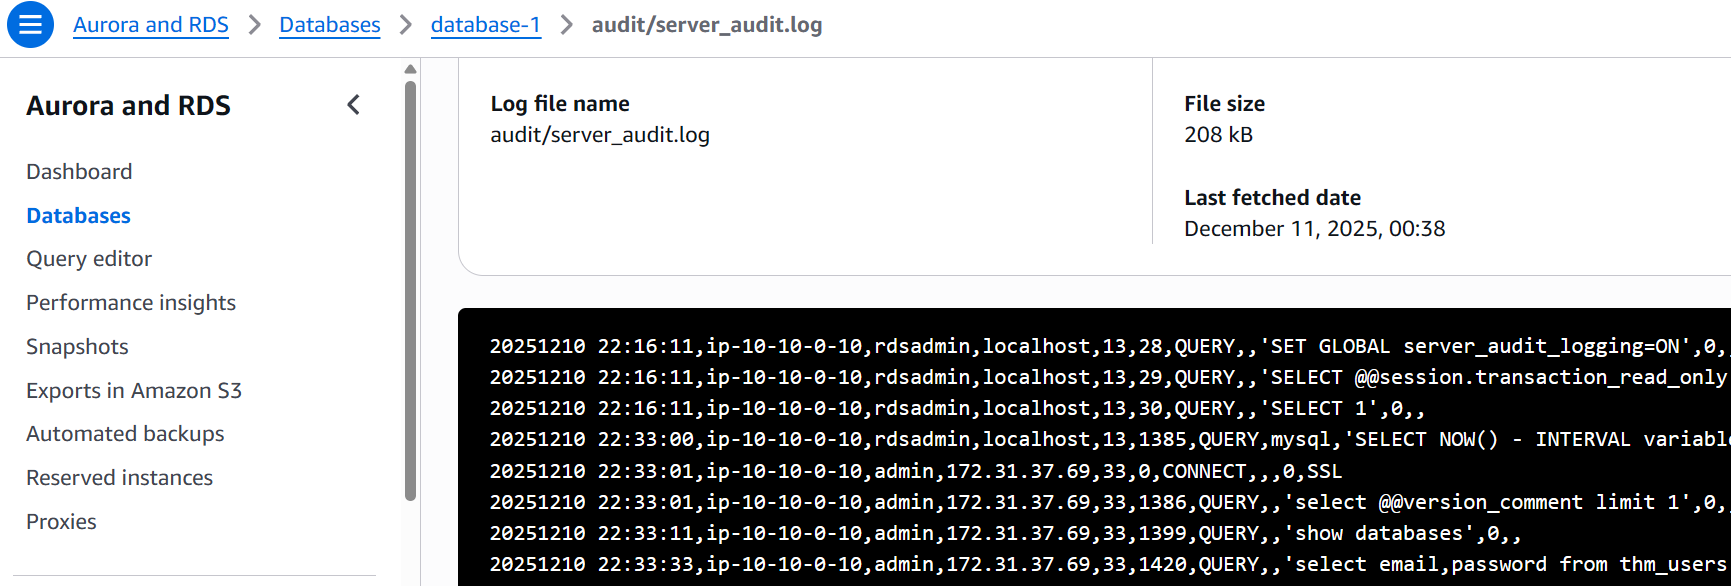
CloudWatch is yet another AWS service widely used for centralized logging and monitoring. While it doesn't replace a SIEM, your DevOps team will likely use it to collect different logs for debugging purposes. Depending on your environment, CloudWatch may contain dozens of service logs, from databases and VMs to Kubernetes and AI. At some point, you may be required to connect CloudWatch with your SIEM to monitor services like RDS:
Practice
Сontinue with the aws index in Splunk. You will work with CloudFront and S3 logs:
index=aws source="cloudfront.log" index=aws source="s3.json"Start with the CloudFront access logs.
Which IP address logged in to the admin portal?
index=aws source="cloudfront.log" cs_uri_stem="/admin/dashboard"

Find an answer in the same CloudFront logs.
How many IPs searched for the "tryhackme" keyword?
index=aws source="cloudfront.log" tryhackme

Now, move on to the S3 Data events.
Which interesting S3 file has been accessed?
index=aws source="s3.json"

Workloads and Services
The previous task focused on logging fully AWS-managed services - solutions like Amazon S3 that the vendor builds, maintains, and patches on your behalf. However, some companies choose not to rely on managed services due to cost concerns, government regulations, or other constraints. Instead, they run the necessary software on EC2 instances or integrate the cloud with their on-premises data centers. For example, they can:
Install PostgreSQL on a virtual machine (EC2) instead of using managed Amazon Aurora
Keep confidential document scans in an on-premises data center rather than in S3
Deploy and configure Nginx web proxies instead of relying on AWS load balancers
Run niche software on EC2 that is not available through any AWS-managed service

SOC approach to monitoring unmanaged versus managed services
For you as a SOC analyst, this approach means reverting to traditional endpoint monitoring. Instead of relying on AWS-managed logging, you will need to install SIEM agents on the VMs, deploy tools like Auditd or Sysmon across your EC2 instances, and keep an eye on software vulnerabilities. If your company uses the cloud only to host virtual machines, your monitoring will look much the same as it would in an on-premises environment.
Small cloud-adopting companies typically run between 5 and 20 EC2 instances, along with a few managed services such as S3 for storing uploaded images. Monitoring is straightforward in such environments. However, at some point, the IT team may decide to migrate workloads into containers (for example, using Amazon ECS) or adopt serverless technologies, such as AWS Lambda. We will cover these in detail in another room, but please keep the following in mind for reference:
| Important Information | Possible Solution |
| Auditd and most EDR solutions don't work effectively in containers. | Use cloud-native tools such as Falco, or CWPP solutions like Wiz. |
| All traditional monitoring agents can't operate in serverless workloads. | Use CWPP or refer to AWS security guidelines for that specific service. |
| You can't protect cloud environments without understanding containers. | Master your Linux knowledge and learn about containers and Kubernetes! |
How would you call a service that is built and maintained by the cloud vendor? Managed Service
Which cloud workload monitoring tool was mentioned as an alternative to Auditd? Falco
CloudTrail, CloudFront, CloudWatch, and many more - feels like a lot to learn, right? Don't worry, you will explore some of these services in much greater detail in the upcoming rooms. Think of this room as a general reference you can return to whenever you need a refresher. Hopefully, you enjoyed it!
The concepts explained throughout this room are applicable to most cloud providers. For example, AWS CloudTrail maps to Azure Activity Log in Microsoft Azure and to Cloud Audit Logs in Google Cloud. By understanding the fundamentals explained in this room, especially the three security areas, you will be able to switch between cloud platforms with ease after some practice.
This room provided hands-on experience with AWS security logging across multiple log sources: - CloudTrail for control plane API monitoring - GuardDuty for automated threat detection - CloudFront and S3 logs for service-specific activity - VPC Flow Logs for network visibility Key takeaway: Effective cloud security requires understanding which logs capture what activities. CloudTrail shows WHO did WHAT, GuardDuty shows WHY it's suspicious, and service logs provide the detailed context. The investigation revealed how an exposed EC2 instance was used for cryptocurrency mining, demonstrating the importance of monitoring security group changes and establishing baseline behaviors in cloud environments.